
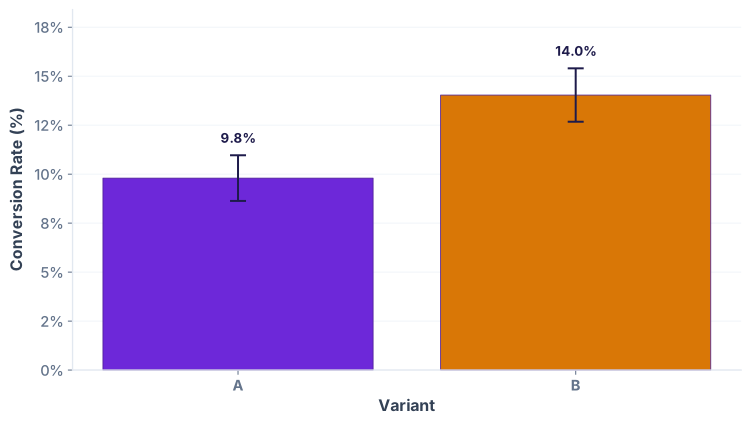
Tunde is a growth analyst at Flutterwave's checkout team in Lagos. Two weeks ago, the product team shipped a new checkout flow (variant B) on 50% of traffic. The other 50% sees the old design (variant A). Now Tunde has data: 2,500 users in each variant, and variant B shows 14% conversion vs. A's 10%. That's a 40% lift! But Tunde's boss asks: "Is this real improvement, or just luck?"
Tunde can't just eyeball the difference and celebrate. With real checkout data, randomness matters. Maybe if he ran it again, variant B would be worse. His job: prove variant B's win is unlikely to be by chance, quantify the lift with confidence, and decide: keep it or keep testing?
- Understand what A/B testing actually proves (and doesn't)
- Compute conversion rates and lift from raw event data
- Use chi-squared tests to compute p-values and test statistical significance
- Interpret confidence intervals: when is a difference real?
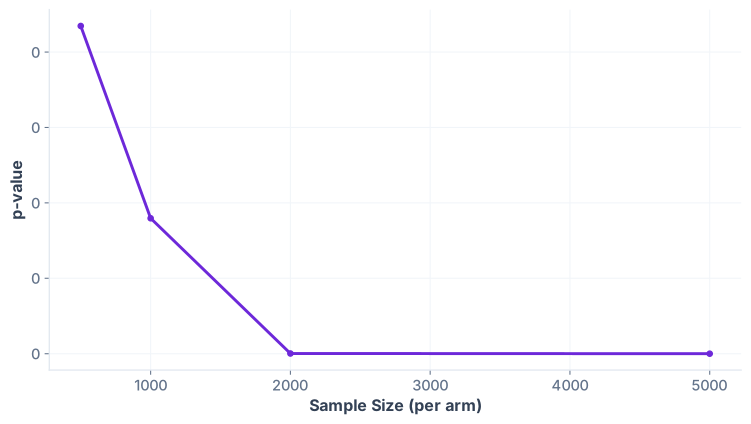
- Recognize sample size effects: why 500 rows is not enough
- Spot common pitfalls: peeking, Simpson's paradox, multiple testing
- Decide when to stop testing and scale the winner
What is A/B Testing?
A/B testing (or split testing) divides users into two groups: one sees variant A (control), the other sees variant B (treatment). You measure an outcome (conversion, click-through, session length) and ask: Is the difference in outcome statistically significant?
Why not just compare? Because random noise always exists. With 100 users, you might see 11% convert with variant A and 14% with B—but that could be luck, not a real improvement. With 10,000 users per variant, a 1% difference is usually real. A/B testing is the scientific method for product decisions.
Computing Conversion Rates and Lift
Start with event-level data: each row is a user session. Count conversions by variant, compute rates, then calculate lift (the % improvement).
Statistical Significance & P-Values
A difference in conversion rates doesn't automatically prove causation. Random variation creates noise. To test if variant B is truly better, we ask: If A and B were identical, how likely would we see a difference this large (or larger) by chance alone? That probability is the p-value.
The standard threshold is p < 0.05 (5% chance of observing the data if there's no real difference). When p < 0.05, we say the result is statistically significant — the difference likely reflects a real improvement, not noise.
Why Sample Size Matters: The Power of Large N
Statistical significance depends heavily on sample size. A 1% difference in conversion with 100 users per arm is almost never significant. The same 1% difference with 100,000 users per arm is highly significant. Why?
Larger samples reduce random variation. The standard error of a proportion is inversely proportional to √n. Doubling your sample size cuts the standard error by ~29%, making it easier to distinguish signal from noise. This is why large-scale A/B tests in tech companies run for weeks or months: they need sufficient power to detect real but modest improvements.
Segmented Analysis: Variant Performance by Device
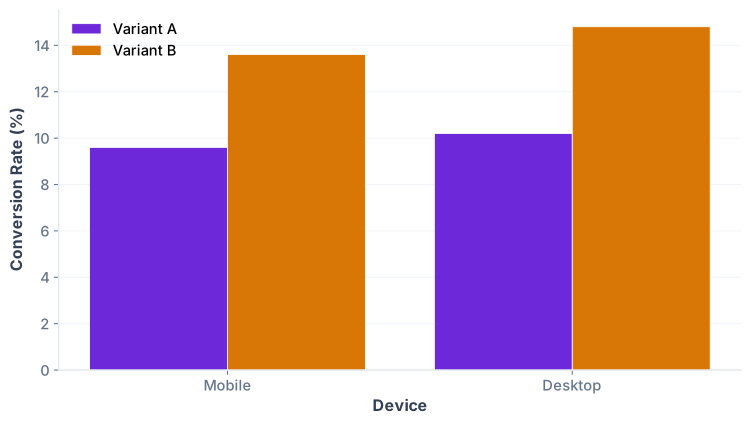
A/B test results often hide important variations. Variant B might win overall, but lose on mobile. Segment your analysis by key dimensions: device, geography, user segment. This reveals interactions where a variant excels in one subgroup but fails in another.
Beyond Conversion: Order Value Matters
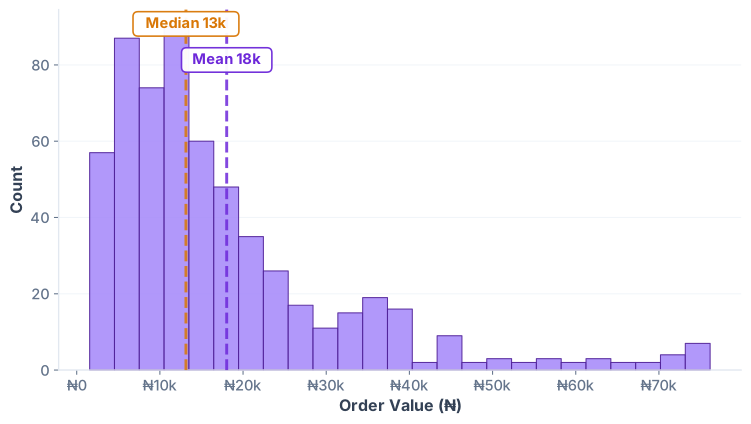
Conversion rate is one metric, but revenue is what scales companies. Two variants can have the same conversion rate but different order values. Always measure order value (or revenue per session) alongside conversion.
Common A/B Testing Pitfalls
1. Peeking: Stopping Early When You See "Winning"
The problem: You run a test, and after 3 days you see variant B ahead with p=0.04. You declare victory. But you violated the statistical contract—you were supposed to run the test for 2 weeks at fixed sample size. Stopping early inflates false positives. This is called "peeking."
The fix: Decide sample size in advance. Don't glance at results daily. Wait until you reach the target N, then analyze once.
2. Simpson's Paradox: Aggregation Hides Reversals
The problem: Variant B wins overall, but loses in every segment (mobile, desktop, each country). How is this possible? It's Simpson's Paradox: the segment sizes differ. Variant B got more traffic from a high-converting segment, making it look good in aggregate, but it actually underperformed.
The fix: Always segment your analysis. If aggregate results contradict segment results, investigate segment sizes and composition.
3. Multiple Testing / Repeated Testing
The problem: You run 20 A/B tests. Even if all variants are identical, you expect ~1 to be "significant" at p<0.05 by chance (multiple testing problem). Report all tests, adjust p-value thresholds (e.g., use p<0.01 for multiple tests), or use Bonferroni correction.
The fix: Decide on your metrics and variants in advance. Don't fish for significance by testing dozens of combinations post-hoc.
4. Confounding Variables
The problem: You test a new checkout flow. Traffic is randomly split... but variant B is deployed only on weekdays, and variant A runs 24/7. Weekday traffic is higher-quality (office workers), so B looks better. But the improvement isn't the checkout flow; it's the timing.
The fix: Ensure randomization is clean. Use A/B testing platforms that enforce date-agnostic rollout. Control for time-of-day, day-of-week, and other confounds in analysis.
When to Stop: Declaring a Winner and Scaling
Three scenarios:
- Significant and practical: p < 0.05 AND lift > 2% (or your business threshold). Scale the winner. You've found a real, meaningful improvement.
- Significant but too small: p < 0.05 BUT lift < 1%. The difference is real, but not worth the engineering effort to deploy. Archive the test and move on.
- Not significant: p ≥ 0.05. You have two choices: run longer (more power) or declare no difference and either keep variant A or roll a coin. Don't pick B just because it's numerically higher.
Once you declare a winner, set a monitoring dashboard. A/B test improvements sometimes regress over time due to habituation, seasonality, or bugs. Track the winning variant in production for 2–4 weeks post-launch.
Master A/B testing and drive real decisions.
Join the Best AI Program: The AI-Era Analyst — 5 months, fully online, with placement assistance. Week 1 is free.
Explore The AI-Era Analyst →