
You're analyzing merchant health KPIs from a global payments processor. You've just calculated the correlation between support ticket volume and merchant churn rate: r = 0.82 (strong positive). Your instinct: "More support tickets cause churn!" But is that right? Maybe merchants struggling technically contact support more before leaving. Or maybe both are signals of a deeper merchant quality issue. The correlation is real, but the causation story needs evidence. This lesson teaches you how to spot the difference—and avoid billion-rupee mistakes in product decisions.
What Correlation Is (and Isn't)
Correlation quantifies how two variables move together. When one goes up, does the other tend to go up too? Down? Not at all?
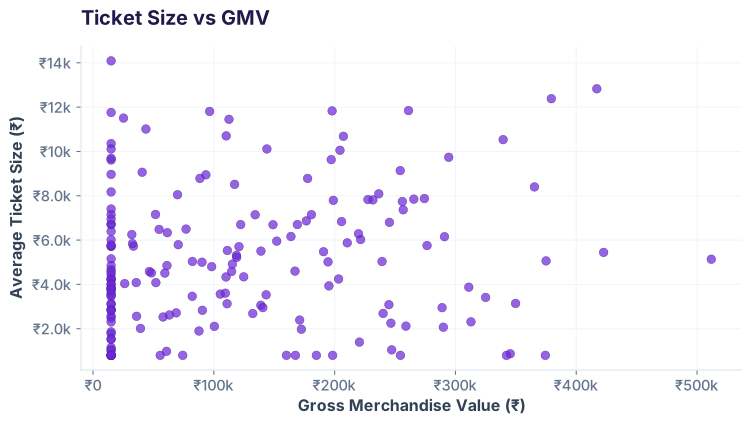
r.
The word "correlation" does three things
1. Describes direction: positive (both go up), negative (one up, one down), or zero (no pattern).
2. Describes strength: how tightly the points cluster around an imaginary line.
3. Does NOT say one causes the other. That is the trap.
The -1 to +1 Scale: Understanding r
Correlation is always between -1 and +1. Here's what the landmarks mean:
The `.corr()` Matrix: See All Relationships at Once
In pandas, one line shows you how every numeric column correlates with every other:
Output: A table where each cell is an r value. Here's the merchant data:
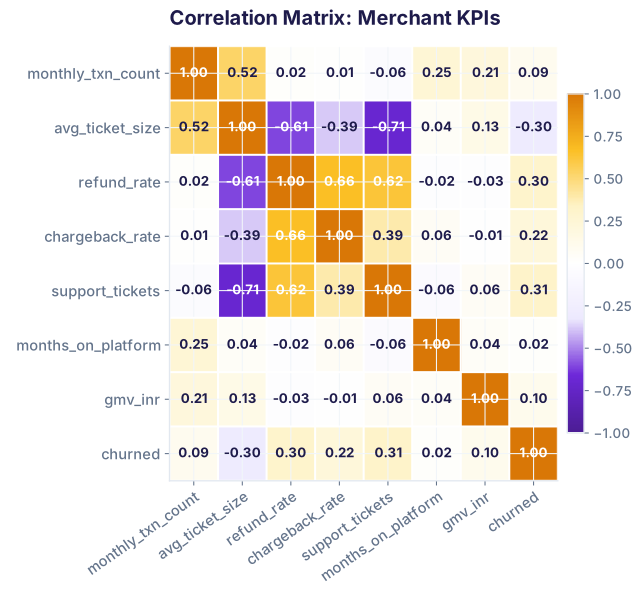
refund_rate ↔ chargeback_rate: r = 0.66 (both are quality signals). support_tickets ↔ churned: r = 0.31 (related, but not perfectly predictive). monthly_txn_count ↔ gmv_inr: r = 0.21 (weak—because GMV depends on ticket size too).
Pearson vs Spearman: When to Use Each
There are two main correlation formulas. They give different answers when the relationship is non-linear.
Pearson (default in pandas)
Assumes a linear relationship. If your data has a curve or U-shape, Pearson can give misleading r values. Example: support ticket count vs. merchant quality follows a U (bad merchants and top performers both contact support often).
Spearman
Compares ranks, not raw values. A merchant with 5 support tickets ranks higher than one with 2. It doesn't care about the exact distance. Perfect for spotting monotonic (always increasing or always decreasing) relationships.
The Causation Trap: Three Ways Correlation Lies
A strong correlation does NOT mean one variable causes the other. Here are the three reasons why:
🔗 Confounding Variable
Both variables are caused by something else. Example: Ice cream sales ↔ drowning deaths (r ≈ 0.95). Does ice cream cause drowning? No—summer causes both. Smart merchants have high GMV AND low churn (both caused by good operational practices), not one causing the other.
↔️ Reverse Causation
You've got the arrow backwards. Do support tickets cause churn? Or do struggling merchants contact support more often before leaving? Rebecca's data shows r = 0.31, but the direction is ambiguous from correlation alone.
🎲 Pure Coincidence
Two unrelated things drift together randomly. Test 100 random variables against each other; some will correlate by chance (p-hacking). Real example: Pirates 🏴☠️ vs. Global warming, r = -0.97 over 300 years. Same ship? No—pure statistical noise.
When Correlation IS Useful (Despite Its Limits)
Correlation is not causation, but it's not useless either. Use it for these three things:
✓ Feature Selection
When building a model, drop features that are highly correlated with each other (r > 0.9). They're redundant and inflate variance. Keep the one that makes business sense.
✓ Quick Sanity Check
Before you model or experiment, check: does my hypothesis show *any* correlation? If GMV and churn are uncorrelated (r ≈ 0), your theory is probably wrong. Correlation is a necessary, not sufficient, condition.
✓ Anomaly Detection
Track correlation over time. If support_tickets ↔ churned suddenly breaks from r = 0.31 to r = -0.05, something changed in your product or merchant base. Worth investigating.
Quick Decision Flowchart
Test Your Understanding
Three questions to lock in what you've learned.
Question 1 of 3: What does r = -0.85 mean?
Select the best interpretation.
Question 2 of 3: When do you prefer Spearman over Pearson?
Select all that apply.
Question 3 of 3: Two variables have r = 0.92. What can you conclude?
Choose the most accurate statement.
Learn Regression (Next Step)
Join the Best AI Program: The AI-Era Analyst — 5 months, fully online, with placement assistance. Week 1 is free.
Explore The AI-Era Analyst →