
Arjun works nights as a data analyst at SouthBank India, a consumer-lending fintech in Hyderabad. His product team is seeing fewer loan disbursements week-on-week, but they don't know where users are dropping out. Are they abandoning after viewing rates? Failing KYC checks? Being rejected by credit? Or is one channel (App, Web, Branch, Agent) hemorrhaging users while others convert?
He has 3,000 application records flowing through a 5-stage funnel: viewed → started → KYC verified → credit approved → disbursed. Tonight he'll run pandas groupby and value_counts to trace each drop, segment by channel, and spot the biggest leak. One code cell can reveal which stage needs urgent fixing.
- Count users at each funnel stage with
.value_counts() - Preserve stage order using categorical dtype
- Calculate stage-to-stage conversion rates (not just percentages)
- Identify the biggest dropoff in absolute and percentage terms
- Segment funnel by channel to find bottlenecks per channel
- Analyze drop reasons to recommend product fixes
- Use
.groupby()for multi-dimensional funnel slicing
What is a funnel? The 5-stage loan path
A funnel tracks users through sequential steps. In Arjun's case, users move through loan application stages: they first view rates and terms (stage 1), then submit an application (stage 2), pass KYC checks (stage 3), get credit-decision approval (stage 4), and finally receive disbursement (stage 5). Most drop out at each step — that's normal. Your job is to measure exactly how many reach each stage, calculate the conversion rate, and find where the biggest leak is.
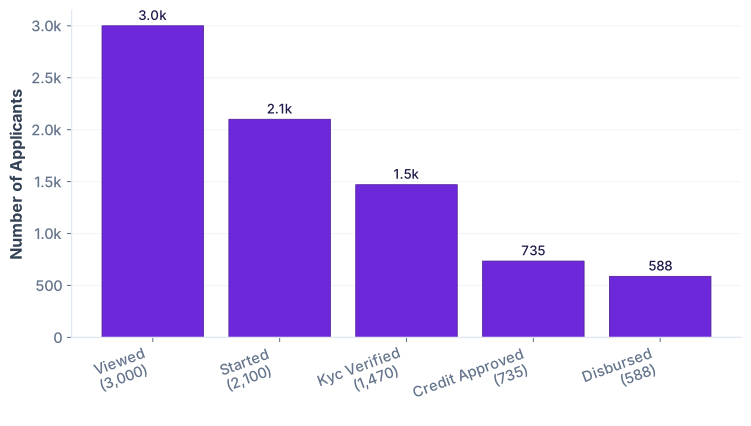
last_stage_reached tells you the furthest stage the user got to (or where they dropped). No separate status code—just the honest truth: did they make it to viewed, started, KYC, approved, or disbursed? This format is perfect for funnel analysis.
Counting users at each stage with .value_counts()
Your first instinct is to count: how many users reached viewed? How many started? KYC? This is where .value_counts() shines. But watch out: the stage order (viewed first, disbursed last) won't sort alphabetically. You need to tell pandas the correct order using a categorical dtype.
.value_counts() sorts alphabetically (credit_approved first, viewed last) — the opposite of your funnel. By defining categories=stage_order, pandas remembers the real sequence. .sort_index() then respects that order.
Stage-to-stage conversion rates: where do users leave?
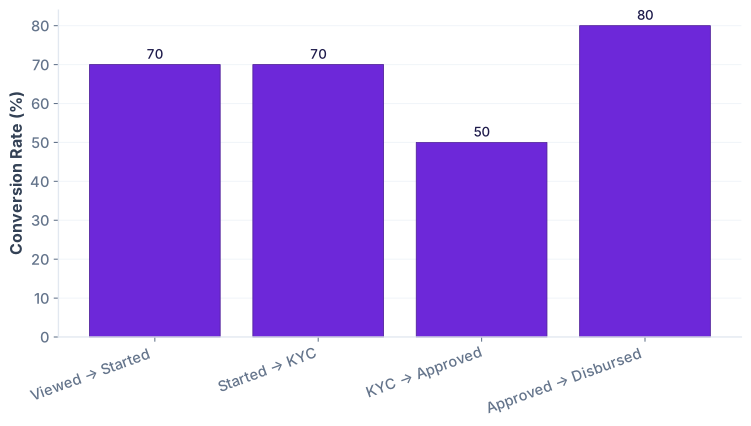
Counting is half the battle. The other half is conversion: what % of users who started actually completed KYC? What % of KYC-verified got credit approval? These rates reveal which stage has the worst leakage. A 70% conversion is typical for early stages (viewing to apply); a 50% KYC-to-approval suggests stricter credit checks; and an 80% approval-to-disburse is great.
Spotting the biggest leak: absolute vs percentage dropoff
Two ways to measure "biggest leak":
- Absolute: How many users actually dropped out? (Viewed to Started loses 900 users.)
- Percentage: What % converted? (KYC to Approved only 50% convert.)
Both matter, but for different reasons. Absolute numbers tell you revenue impact (900 lost applications = lost loan origination volume). Percentages tell you stage severity (50% pass-through is a dangerous gate).
Slicing by channel: which path converts best?
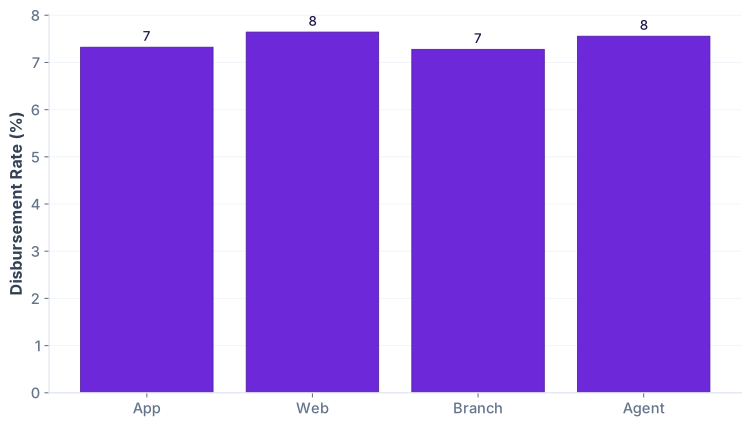
Not all users come the same way. Some apply via the mobile App, others via the Bank's website, visit a Branch, or work with an Agent. Each channel has different friction. App users might bounce due to UI lag. Branch users might have longer wait times. Analyzing funnel by channel reveals which needs improvement.
Understanding drop reasons: why do users leave?
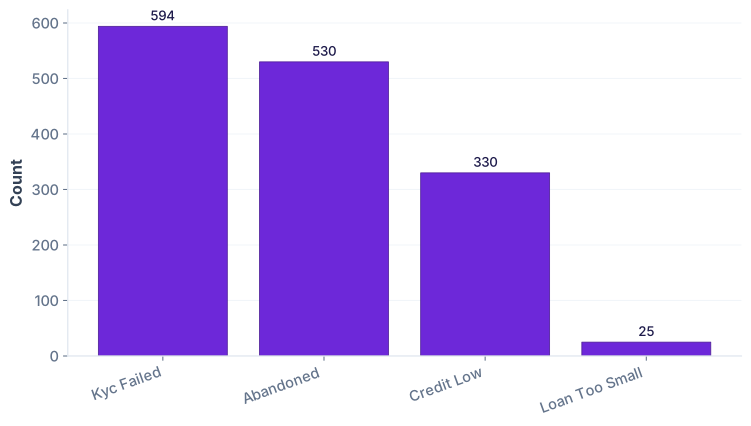
Not all dropoffs are equal. Some users abandon because they're not interested (natural). Others fail because the product rejected them (KYC failed, credit low). Understanding drop reasons tells you what to fix: product friction vs. natural market forces.
You're ready to move to RFM segmentation and cohort analysis.