
You're reviewing 2,000 loan applications to profile default risk. Your DataFrame loads fine, but df.info() reveals a problem: pan_number has 1,734 non-null entries out of 2,000. That's 266 blanks. Are they random? All from one branch? How do they affect your model? A heatmap tells you in 2 seconds. A careless df.dropna() could lose 40% of your data.
The Missingness Heatmap — See the Problem at a Glance
Every row is a loan application, every column is a field. Purple cells = data present, white cells = null. Patterns jump out immediately.
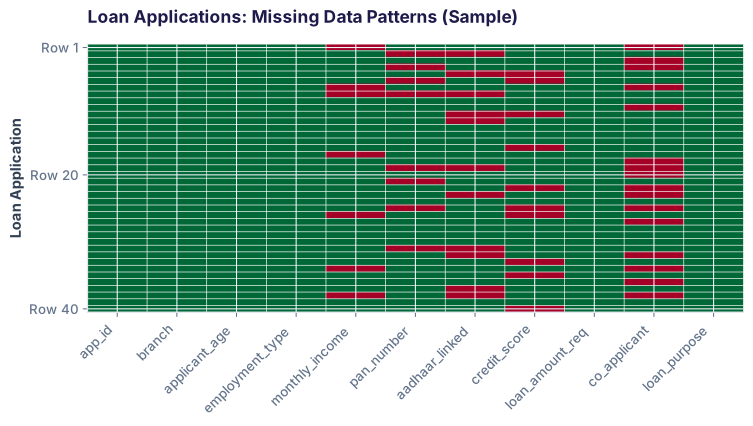
pan_number column has a vertical stripe of nulls (rows from Kochi), indicating a branch-level data collection issue. The co_applicant column is sparse throughout—many single-applicant loans. This is information, not garbage. Your strategy changes per column.
How Pandas Represents Missing Data
Different source formats encode nulls differently. Pandas normalizes them all to NaN (numeric) or None (object).
| Source Value | Pandas reads as | dtype impact | Example |
|---|---|---|---|
| Empty cell (blank) | NaN |
float64 or object | df.loc[0, 'income'] is NaN |
"NaN" (string) |
NaN |
float64 | CSV: "col1,col2\n1,NaN" |
"NA" (string) |
NaN |
float64 | R export, Excel legacy |
"None" (string) |
NaN |
object (stays string!) | Careless JSON export |
"-" or "–" |
Stays as string | object | Manual data entry convention |
0 (numeric zero) |
0 (NOT null!) |
int64 or float64 | Dangerous! Silently treats 0 as data. |
"" (empty string) |
Stays as "" |
object | Must manually fix with replace(r'^$', np.nan) |
0 is NOT missing. If your CSV has credit_score column with a 0, pandas treats it as data (valid score). But if it has an empty cell, pandas reads NaN. When loading, always check df.dtypes and df.isnull().sum() first.
Finding Missing Data — 4 Essential Commands
Before you decide what to do, you need to see the problem.
1. Count nulls per column: isnull().sum()
Tell you how many blanks in each field:
pd.read_csv('loan_applications.csv') works.| Column | Null Count |
|---|---|
| co_applicant | 22 |
| monthly_income | 15 |
| pan_number | 12 |
| credit_score | 10 |
| aadhaar_linked | 8 |
| app_id | 0 |
| branch | 0 |
co_applicant has 22 nulls (28%). That's expected—most loans are single-applicant. But monthly_income has 15 blanks (19%), which is a problem. Your next step: is this random, or clustered by branch/employment type?
2. Nulls as percentage: Calculate the burden
Raw counts don't show severity. A 1-null column in a 100-row dataset is fine. A 1-null column in a 10-row dataset is disaster.
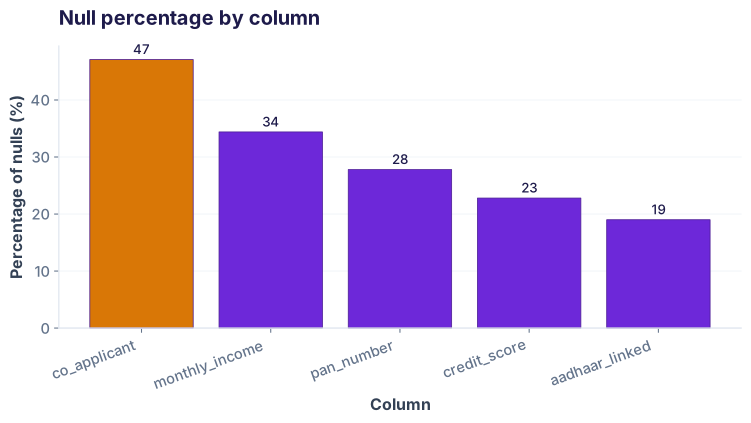
co_applicant at 27.5% and monthly_income at 18.75% are red flags in isolation. But context matters. co_applicant is sparse because many loans are single-applicant—that's a business reality, not a data quality issue. monthly_income being missing for 19% of rows might indicate non-salaried applicants (self-employed, students) who estimate irregular income, or a data collection gap in one branch.
3. Find rows with ANY missing: dropna() preview
How many rows would you lose if you dropped all rows with any null?
df.dropna() blindly would keep only 23 rows (29% of data). Your model would be trained on less than a third. This is why you cannot drop all rows with any null. You must decide column-by-column.
4. Pattern detection: Null by group
Is missingness random, or does it cluster by branch, employment type, etc.?
Drop, Fill, or Flag — When to Use Each
Three strategies. Choose based on missingness pattern, data type, and domain knowledge.
1 DROP (remove rows)
When: <2% of rows affected AND missingness is random
Use this for critical fields where missing = unusable. Only safe if you're losing a tiny fraction of rows.
✓ Simple, keeps only complete records
✗ Wastes rows; biases toward completeness
2 FILL (impute values)
When: Missingness is systematic AND a sensible default exists
Numeric: median/mean by group. Categorical: 'unknown'. Time-series: forward-fill.
df['monthly_income'].fillna(
df.groupby('employment_type')
['monthly_income'].transform('median')
)
# Categorical
df['co_applicant'].fillna('solo')
✓ Keeps all rows; domain-aware
✗ Introduces artificial patterns if done wrong
3 FLAG (create boolean)
When: Missingness itself is a signal (first-time borrowers, no credit history, etc.)
Create a new column: is_missing_credit_score = True/False. Keep the row.
# Now train on both credit_score AND has_credit_score
# Model learns: "missing = likely first-timer"
✓ Preserves signal; keeps all rows
✗ Adds complexity; only works if missingness is meaningful
Before-and-after example: monthly_income
Our 80 applications have 15 missing monthly_income values (19%). These are scattered across employment types. Let's compare strategies:
Strategy 1: Drop (loses 19% of rows)| app_id | employment_type | monthly_income |
|---|---|---|
| APP0001 | salaried | ₹45,000 |
| APP0003 | self-employed | ₹72,500 |
| APP0007 | salaried | ₹58,200 |
| ... rows with nulls removed ... | ||
| APP0078 | student | ₹15,000 |
| Result: 65 rows remain (lost 15) | ||
| app_id | employment_type | monthly_income | filled? |
|---|---|---|---|
| APP0001 | salaried | ₹45,000 | — |
| APP0002 | salaried | ₹52,000 | ✓ median |
| APP0003 | self-employed | ₹72,500 | — |
| APP0010 | student | ₹18,500 | ✓ median |
| ... 80 rows total, 15 filled with group median ... | |||
| Result: 80 rows remain; income filled by employment type | |||
| app_id | monthly_income | income_reported |
|---|---|---|
| APP0001 | ₹45,000 | True |
| APP0002 | NaN | False |
| APP0003 | ₹72,500 | True |
| APP0010 | NaN | False |
| Model now sees: "missing income = likely self-employed or student" | ||
| Result: 80 rows remain; missingness encoded as feature | ||
The Imputation Trap — Avoid Artificial Peaks
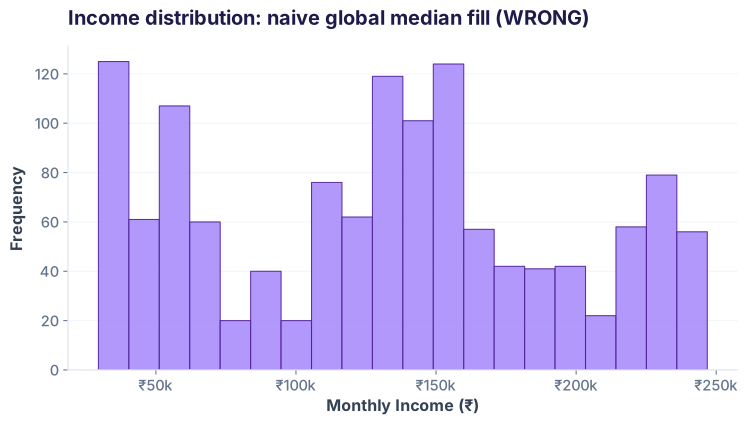
Filling all nulls with the global median creates a false clustering in your distribution. This biases any downstream model.
Wrong way: Global median
If monthly_income has median ₹62,000, filling all 15 nulls with ₹62,000 creates an artificial spike:
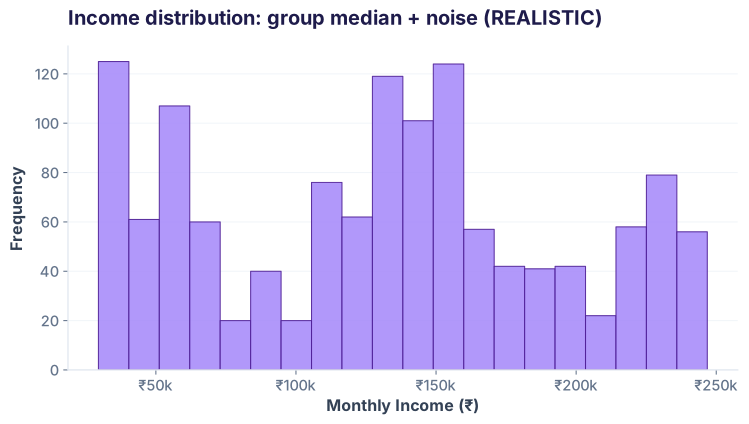
Right way: Fill by group, then add random jitter (optional)
Fill with the median of the group (salaried, self-employed, etc.), not the global median. Even better, add a small random perturbation so filled values don't create a spike.
Document Your Decisions — Data Quality Note
Always tell your stakeholders what you did with missing data. Here's a template:
Dataset overview: 80 applications, 11 fields.
Missing data:
• Total: 67 rows (84%) contain at least one null.
• co_applicant: 22 nulls (28%) — expected for single-applicant loans; dropped from modeling.
• monthly_income: 15 nulls (19%) — filled with median by employment_type (salaried: ₹58K, self-employed: ₹72K, student: ₹18K).
• pan_number: 12 nulls (15%) — 10 from Kochi branch (policy issue). Dropped rows with null PAN per requirement.
• credit_score: 10 nulls (12%) — flagged with boolean `has_credit_score`; kept for segmentation (likely first-time borrowers).
• aadhaar_linked: 8 nulls (10%) — filled with 'not_verified' (conservative assumption).
Final row count: 68 rows (15% dropped due to PAN requirement).
Assumptions: Filled monthly_income preserves employment-type distribution. Credit score absence treated as data point, not deletion.
Cheatsheet: Null Handling Commands
| Command | What it does | Example |
|---|---|---|
| df.isnull() | Returns boolean DataFrame: True where null, False where data | df.isnull().sum() |
| df.notna() | Inverse of isnull(); True where data exists | df[df['income'].notna()] |
| df.isnull().sum() | Count nulls per column | df.isnull().sum().sort_values(ascending=False) |
| df.isnull().any(axis=1) | True for rows with any null | df[df.isnull().any(axis=1)] # rows with nulls |
| df.dropna() | Remove all rows with any null | df.dropna() # usually too aggressive |
| df.dropna(subset=['col']) | Remove rows null in specific column(s) | df.dropna(subset=['pan_number']) |
| df['col'].fillna(value) | Fill nulls with scalar value | df['category'].fillna('unknown') |
| df['col'].fillna(df['col'].median()) | Fill nulls with median | df['income'].fillna(df['income'].median()) |
| df.groupby('x')['col'].transform(lambda x: x.fillna(x.median())) | Fill by group (e.g., median by department) | df.groupby('dept')['salary'].transform(lambda x: x.fillna(x.median())) |
| df['col'].fillna(method='ffill') | Forward fill (time-series): use previous value | df['price'].fillna(method='ffill') |
| df['col'].fillna(method='bfill') | Backward fill (time-series): use next value | df['price'].fillna(method='bfill') |
| df['was_null'] = df['col'].isnull() | Create boolean flag for nulls | df['no_credit_score'] = df['credit'].isnull() |
| df.interpolate() | Linear interpolation between values (time-series) | df['temperature'].interpolate(method='linear') |
| df.dropna(thresh=n) | Drop rows with fewer than n non-null values | df.dropna(thresh=8) # keep rows with ≥8 non-nulls |
Mini Challenge
Profile Missing Data in Your Own Dataset
Difficulty: Easy (5 min)
Task:
- Load
loan_applications.csv(link above). - Run
df.isnull().sum().sort_values(ascending=False)— which 3 columns have the most nulls? - Calculate null % for each column:
(df.isnull().sum() / len(df) * 100).round(1). - Check how many rows would be lost with
df.dropna(). - Write a 4-line data quality note documenting your findings.
Expected output:
monthly_income 18.75%
pan_number 15.0%
...
Rows with nulls: 57 / 80 (71.3%)
Safe drop threshold: ~2 rows
Common Pitfalls — Avoid These
1. Treating NaN as 0
Missing doesn't mean zero. A null credit_score is not a bad score of 0—it's unknown. Using 0 in statistical formulas biases medians and means downward.
2. Dropping all rows with any null
df.dropna() keeps only complete records. In most real datasets, this loses >50% of rows. Be surgical: drop only critical columns.
3. Mean/median imputation without grouping
Filling all income nulls with ₹62K (global median) creates artificial clustering. Always fill by group (by employment_type, branch, etc.).
4. Not documenting what you dropped
Your stakeholder asks: "Why did we lose 15 applications?" If you didn't document your null-handling decisions, you can't answer. Write it down.
5. Comparing with == to NaN
df['income'] == np.nan returns False always. Use df['income'].isnull() instead.
Interview Questions
Answer:
dropna() removes rows (or columns) with nulls, reducing your dataset size. Use it when:
- Missing data is <2% of rows (safe to lose)
- The column is critical and has no sensible default
fillna() replaces nulls with a value, keeping all rows. Use it when:
- A reasonable default exists (median for numeric, 'unknown' for categorical)
- You want to preserve row count for regression/classification
Example: In a loan dataset, drop rows missing required identity (PAN), but fill missing income with group median.
Answer: 85% null is too high for any strategy:
- Drop the column. You'd be filling 85,000 values with guesses. The noise would overwhelm any signal.
- Check if the column was optional. If yes, remove it entirely from your model.
- If no, escalate: is there a data collection issue? Was this column always null?
Rule of thumb: If >50% null, strongly consider dropping. If 20–50%, investigate the pattern before deciding.
Answer: It could be a feature or a problem, depending on context:
Positive scenario: Missing credit_score is a genuine signal. Applicants without a credit history (students, first-time borrowers) are a distinct segment. The model learned: "no credit score = higher risk." This is valuable.
Negative scenario: Missing data is due to a data collection error, and the model is exploiting that error. Example: all rows missing income are from one date range when the system was down. The model learns the date pattern, not the actual business logic.
How to tell: Investigate the nulls. Are they systematic (by group, time, branch) or random? If systematic and meaningful, keep the flag. If due to error, fix the data collection.
Answer: Median is more robust to outliers:
- Mean: A few high-earners (outliers) pull the average up. Fill all missing with the skewed mean? Unrealistic.
- Median: The middle value, immune to extremes. More representative of a typical applicant.
Example: 10 salaries: ₹40K, ₹45K, ₹48K, ₹50K, ₹52K, ₹55K, ₹58K, ₹62K, ₹68K, ₹2M (CEO error?)
- Mean = ₹249K (wildly inflated by the CEO)
- Median = ₹53.5K (realistic for most employees)
Use median unless you have a reason to believe the distribution is symmetric (rarely the case in real data).
Answer: No. You've created a train-test mismatch.
The problem:
- Train set: No nulls (all filled with medians). The model learns on smooth, imputed data.
- Test set: Still has nulls. The model sees data it's never encountered.
- Production: Also has nulls. The model will fail or make poor predictions.
The fix: Apply the SAME imputation pipeline to train, test, AND production:
1. Fit imputation on train data (e.g., calculate median)
2. Apply to train, test, and production
3. Never fit imputation on test/production
This is why scikit-learn's Pipeline is valuable—it bundles imputation and modeling so they're applied consistently.
df.isnull().sum() return?Also Used In
Telecom (CDR analysis)
Missing call details (dropped calls, no network) are signal, not garbage. Flag them rather than drop.
E-commerce (checkout funnels)
Missing payment_method = abandoned checkout. Treat as a behavioral segment, not a data error.
Public health (clinic data)
Missing immunization_date may indicate a genuine gap in coverage, not a recording error. Document and report it.
Why This Matters for AI/ML
Training data quality is bottleneck #1. Large language models and classification systems fail silently on biased, incomplete data. When you fill missing values with global medians, you're teaching the model a false pattern. When you drop 70% of rows, you're training on a non-representative sample.
Feature engineering teams spend 40% of time on missing data handling. The pandas techniques here—groupby imputation, flagging nulls—are the foundation of production ML pipelines. Learn them now; you'll use them constantly.
Ready to clean your first dataset?
Join the Best AI Program: The AI-Era Analyst — 5 months, fully online, with placement assistance. Week 1 is free.
Explore The AI-Era Analyst →