
It's month-end Thursday. You've spent the past three days in Jupyter — 30 cells of analysis, charts, pivot tables, fraud insights. Your CFO needs (1) a 12-page PDF she'll read on her Friday morning flight to Mumbai, and (2) a 6-slide deck for the board review that afternoon. You have one notebook, two deadlines, three formats (PDF, slides, maybe HTML). Manually copy-pasting is out. You'll learn to publish once and output many: nbconvert for PDFs, Papermill to parameterize runs by merchant category, python-pptx to build the board deck, and when to reach for each tool.
The Problem: Copy-Paste Hell
Imagine your workflow today. You finish analysis in a Jupyter notebook. Then:
- Export the notebook as HTML, open in browser, screenshot charts.
- Manually format tables in Google Slides or PowerPoint.
- Update one number upstream? Start over — re-run cells, re-screenshot, re-paste.
- Your CEO wants the same report for Retail instead of Food & Beverage? 30 cells by hand.
The Solution: Publish Once, Output Many
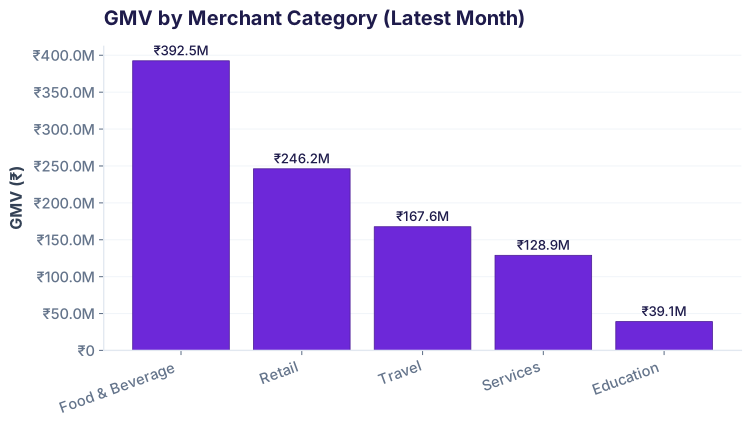
Output Matrix: When to Use Each Format
PDF (nbconvert)
12-page report for executives. Print-ready, portable, no dependencies.
Use when: CEO reads on a plane, audit trail required, static reference needed.
HTML (nbconvert)
Interactive, shareable via email or link. Charts stay interactive if you embed Plotly.
Use when: Stakeholders want to hover-inspect data, need no installation.
Slides (nbconvert + Reveal.js)
6-slide deck for live presentation. One cell = one slide. Navigate with arrow keys.
Use when: Board meeting, investor pitch, live walkthrough needed.
PowerPoint (python-pptx)
Editable .pptx for further customization. Images + KPIs + shapes.
Use when: Marketing needs to edit slides, company brand guidelines strict.
nbconvert Basics: CLI & Flags
Jupyter's built-in export tool. No extra setup if you have Jupyter installed.
Export to PDF
merchant_report.pdf in the same directory. File size ~2–5 MB depending on chart resolution.
Export to HTML
Key flags for production PDFs
--no-input is your friend. Executive PDFs don't show code — only titles, descriptions, and outputs. A 30-cell notebook becomes a 12-page business report.
Common pitfall: Missing LaTeX
If you see xelatex not found, install TeX Live (Linux) or MacTeX (Mac):
Making Charts Report-Ready: DPI, Size, Format
A screenshot chart in a Jupyter notebook is 96 DPI. A printed PDF needs 300 DPI. Learn to save images at production quality.
Save at 300 DPI with matplotlib
dpi=300 in savefig() — the dpi=100 in plt.subplots(figsize=...) is your working canvas; save DPI is the export quality.
Named axes & no legends = professional look
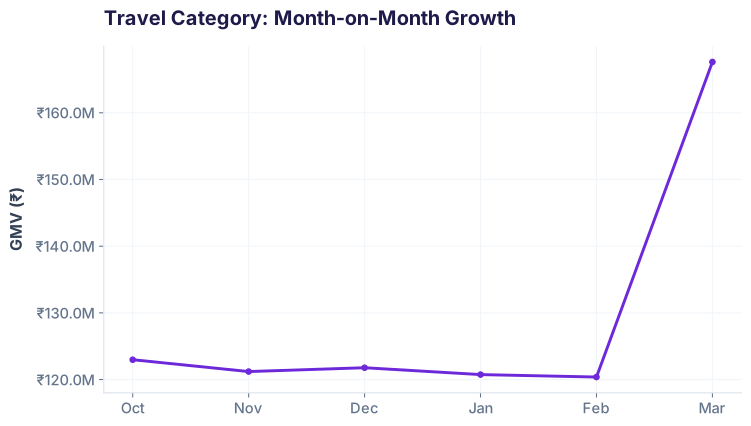
Parameterizing with Papermill: Run Once Per Category
Papermill lets you run a notebook with different parameter values. Write your analysis once, execute it for F&B, Retail, Travel, Education — get four PDFs.
Add a parameters cell at the top of your notebook
Use parameters throughout your notebook
Execute with Papermill from Python
report_food_and_beverage.pdf, report_retail.pdf, etc. in her directory.
Slides: Reveal.js via nbconvert
One notebook cell per slide. Tag cells to control slide breaks, speaker notes, and layout.
Export to Reveal.js slides
Control slides with cell metadata
Embed charts in slides
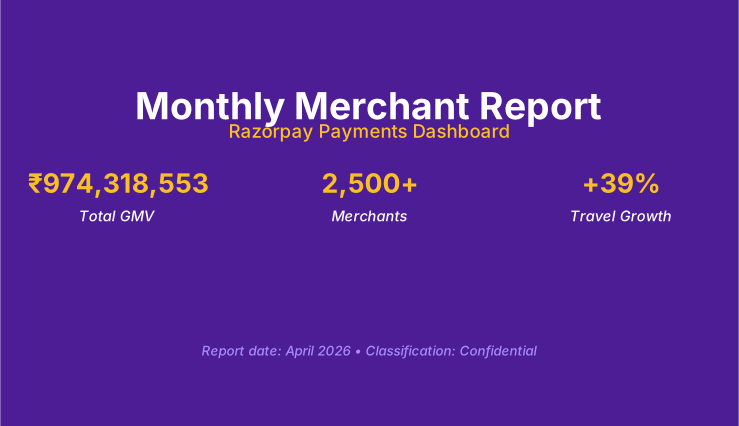
PowerPoint with python-pptx: Full Control
When nbconvert slides aren't enough. python-pptx lets you build a .pptx file from Python: insert images, text, shapes, set fonts & colors.
Install & create a basic deck
The Polish Pass: Metadata, Numbering, Summary
A notebook exported as-is feels rough: cells numbered 1, 8, 3 (execution order), no page numbers, plain Arial font. Polish it for executives.
Add a markdown title block
Hide code cells in PDF export
Add page numbers & footer
nbconvert PDFs don't have page numbers by default. Use a post-processing step with PyPDF2:
Common Pitfalls & Solutions
1. Enormous PDF file size (50+ MB)
Cause: Charts saved at 96 DPI in Jupyter, then embedded as-is. Each high-res PNG can be 2–5 MB.
Fix: Save charts as SVG (vector, scales infinitely, ~200 KB). Or compress PNGs:
2. Charts cut off at page edge
Cause: Figure size too wide for A4 page width. nbconvert's default margins + default fig width = overflow.
Fix: Use bbox_inches='tight' and set figsize to 8.5 inches max:
3. Missing fonts in PDF
Cause: Matplotlib uses a font not embedded in the PDF.
Fix: Embed all fonts or use a standard font:
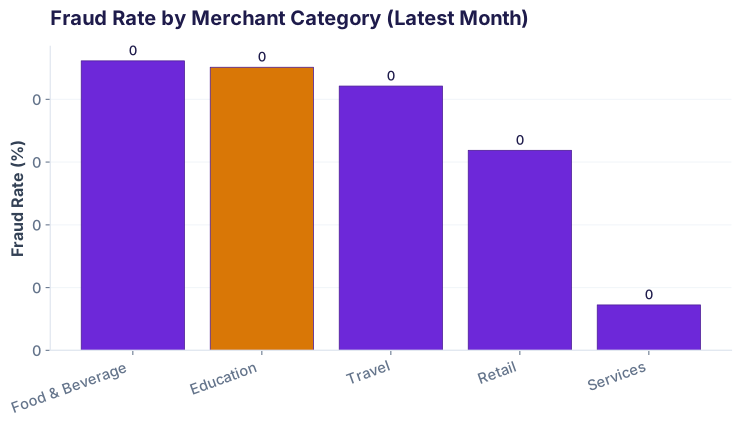
Quick Reference: Export Commands
| Format | Command | Best For | Notes |
|---|---|---|---|
jupyter nbconvert --to pdf --no-input notebook.ipynb |
Executive read, print, archive | Requires LaTeX or pyppeteer | |
| HTML | jupyter nbconvert --to html notebook.ipynb |
Web share, interactive (if Plotly) | Can embed videos, code |
| Slides | jupyter nbconvert --to slides notebook.ipynb |
Live presentation, board meeting | Use cell metadata to control breaks |
| PowerPoint | from pptx import Presentation; prs.save('deck.pptx') |
Custom branding, further editing | Full control, ~20 lines of code per slide |
| Parameterized | pm.execute_notebook(..., parameters={...}) |
Batch reports (one per category, region, etc.) | Install: pip install papermill |
Ready to go further?
Join the Best AI Program: The AI-Era Analyst — 5 months, fully online, with placement assistance. Week 1 is free.
Explore The AI-Era Analyst →