
You're analyzing 120 clinic visits from a rural health NGO to write a donor report. Your dataset loads fine: patient_id, age, systolic BP, glucose, visit duration. But something's off. One patient has BP = 250 mmHg (physically impossible). Another visit lasted 480 minutes (8 hours?). A weight column shows 8 kg for a 35-year-old adult. Are these data-entry errors? Equipment failures? Real medical emergencies? Your report must distinguish signal from noise — donors want accuracy, clinicians want actionable alerts. A boxplot reveals outliers in 30 seconds. Deeper investigation tells you which ones matter.
What Is an Outlier?
An outlier is a data point that differs dramatically from the rest. It stands alone in the distribution's tail. But "different" is not synonymous with "wrong" — every outlier demands investigation.
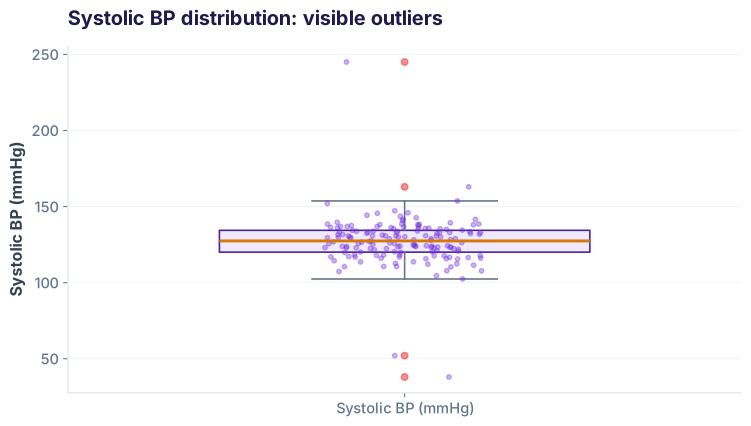
The 1.5 × IQR Rule
The Interquartile Range (IQR) is Q3 − Q1, the spread of the middle 50% of data. Outliers are defined as points below Q1 − 1.5×IQR or above Q3 + 1.5×IQR.
For your clinic data: Q1 = 118, Q3 = 131, IQR = 13. Bounds: 118 − 19.5 = 98.5 (lower), 131 + 19.5 = 150.5 (upper). Any systolic BP > 150.5 or < 98.5 is flagged.
| Patient ID | Systolic BP | Age | Notes |
|---|---|---|---|
| P015 | 142 | 36 | High but real (emergency visit) |
| P046 | 141 | 35 | High but real (hypertensive) |
| P068 | 142 | 35 | High but real (emergency visit) |
| P080 | 144 | 36 | Slight elevation, real patient |
| P092 | 145 | 35 | Systolic 250 is impossible error |
Z-Scores: Another Lens
A Z-score measures how many standard deviations a point is from the mean. Z > 3 or Z < -3 are often flagged as outliers. Z-scores are useful for symmetric distributions but miss outliers in skewed data.
For your glucose data: mean ≈ 98, std ≈ 9. A Z-score of 3 flags glucose > 125 or < 71. Compare IQR vs Z-score results: they often differ, especially with skewed data. IQR is more robust to extreme outliers; Z-scores assume normality.
IQR Rule
Pros: Robust to extremes. Works on skewed data.
Cons: Flags fewer outliers in heavy-tailed distributions.
Z-Score
Pros: Sensitive to extreme values. Good for symmetric data.
Cons: Assumes normality. Misses outliers in skewed data.
Domain-Aware Bounds: The Clinician's View
Statistical rules are useful, but domain expertise trumps math. In healthcare, systolic BP < 60 or > 200 mmHg is physically implausible for a living, conscious patient. A weight of 8 kg for a 35-year-old is impossible. These hard rules catch errors that statistics miss.
In your clinic data:
- Patient P092: glucose = 250 mmHg (no — glucose is mg/dL, not mmHg; data mislabeled)
- Patient P015: visit_duration = 480 min (8 hours for a routine clinic visit — data-entry error, likely 48 min)
- Patient P101: weight = 8 kg (impossible for age 22 — should be ~60 kg)
Handling Outliers: Winsorize, Drop, or Cap?
Once you've identified outliers, you have three choices:
1 Drop the row
Remove the entire row. Simplest, but loses data.
2 Winsorize (cap)
Replace outliers with the boundary value (1st/99th percentile). Keeps all rows, softens extremes.
3 Flag & keep
Add a boolean column. Keep the value, let your model learn it's unusual.
For clinic data: Drop rows with impossible values (P092 glucose error). Flag real emergencies (P015, P046 high BP). Winsorize extreme visit durations if you suspect recording errors but want to preserve the session.
Robust Statistics: Median & MAD
When outliers are present, the mean and standard deviation are unreliable. The median and Median Absolute Deviation (MAD) are robust alternatives.
| Metric | With Outlier | Without Outlier | Change |
|---|---|---|---|
| Mean glucose | 102 mg/dL | 98 mg/dL | +4% bias |
| Median glucose | 98 mg/dL | 98 mg/dL | 0% (stable) |
| Std Dev | 18 mg/dL | 9 mg/dL | +100% inflation |
| MAD | 8 mg/dL | 8 mg/dL | 0% (stable) |
Common Pitfalls
1. Blindly dropping all outliers
Not all outliers are errors. A hypertensive crisis (BP 145) is real and important for clinical care. Dropping it loses signal.
2. Trusting Z-scores on skewed data
In income data, a few high earners skew the distribution. Z-scores become unreliable. Use IQR or domain bounds instead.
3. Using the same outlier rule on all columns
Systolic BP and visit duration have different scales and distributions. A 1.5×IQR threshold may be too strict for one, too loose for another.
4. Not documenting your decision
If you drop 5 rows, note why: "P092 had physically impossible glucose; P101 weight = 8kg for age 22." Stakeholders need transparency.
5. Winsorizing without understanding the impact
Capping outliers at 99th percentile softens their influence but may hide real extremes from your analysis. Check your data before and after.
6. Ignoring the outlier's context
A visit lasting 8 hours is an outlier — but was the patient in a hypertensive crisis needing extended monitoring? Context changes how you handle it.
Outlier Detection Cheatsheet
| Method | Formula / Code | Best for | Weakness |
|---|---|---|---|
| IQR Rule | |q1 − 1.5×IQR|, |q3 + 1.5×IQR| | Any distribution, especially skewed | May flag too many in heavy-tailed data |
| Z-Score | |x − mean| / std > 3 | Symmetric, normal-like data | Fails on skewed data; sensitive to extremes |
| Domain Bounds | x < min_bound or x > max_bound | Medical, financial, physical constraints | Requires domain knowledge; can be subjective |
| Modified Z-Score (MAD) | |x − median| / MAD > 3.5 | Robust detection with outliers present | Less familiar; fewer built-in functions |
Outlier patterns are universal in health data
Whether you're analyzing clinic data in Nakuru (Kenya), Mumbai (India), Manila (Philippines), or Manchester (UK), the same errors appear: keyboard doubles (150 → 250), truncated durations (48 → 480), weight entry in pounds instead of kg. The IQR rule, Z-score, and domain bounds work worldwide. A 250 mmHg BP is impossible everywhere. A baby weighing 8 kg is impossible everywhere. Good clinical reasoning transcends geography.
Ready to build dashboards your stakeholders trust?
Join the Best AI Program: The AI-Era Analyst — 5 months, fully online, with placement assistance. Week 1 is free.
Explore The AI-Era Analyst →