
Pivot Tables & Crosstabs
You've been at the payments processor 6 months. Your manager asks: "Summarize revenue by merchant category and payment method. How does it break down by city?" In Excel, you'd drag columns into a pivot table. In pandas, you'll do it in one line.
- Master
pivot_table(): reshape data with index, columns, values, and aggfunc - Build multi-level aggregations (revenue AND transaction count)
- Add row and column totals with
margins=True - Use
crosstab()for frequency counts (payment method × city) - Normalize crosstabs to answer: "What % of UPI transactions come from Mumbai?"
1. Pivot = Excel's Most-Used Feature, in One Line
Excel's pivot table is the go-to tool for any analyst. You drag fields into rows and columns, and Excel summarizes the data. Pandas does the same with pivot_table()—except it's one function call, not 20 clicks.
Here's the outcome first (picture): a table showing revenue (gross_amount) by merchant category (rows) × payment method (columns).
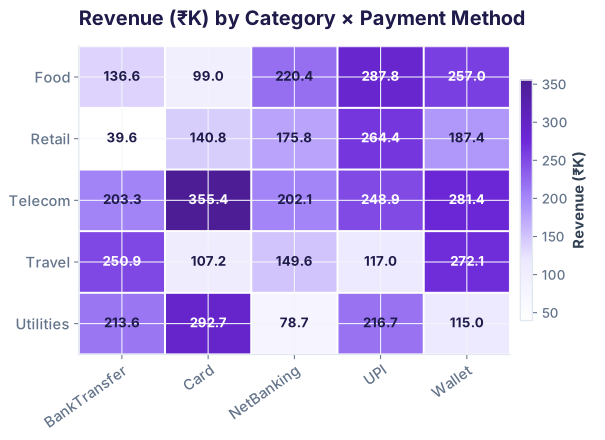
Now, here's how you made it:
index (rows), columns (columns), values (what to sum). aggfunc='sum' means "add up all gross_amounts for each category–method pair."
2. pivot_table() Anatomy: Index, Columns, Values, Aggfunc
Every pivot table has four key parts. Understanding them is the entire game.
pd.pivot_table(df, index='merchant_category', columns='payment_method', values='gross_amount', aggfunc='sum')
index: Which column becomes rows? Answer: merchant_category. Each unique category gets a row.columns: Which column becomes columns? Answer: payment_method. Each unique method gets a column.
values: What do we put in each cell? Answer: gross_amount. (Could also be settlement_id, fee, net_amount, etc.)
aggfunc: How do we combine values when there are duplicates? 'sum' adds them. 'count', 'mean', 'max' also work.
Variation: Revenue by City (rows) × Category (columns)
Same idea, different question: "How much revenue did each city contribute, broken down by category?"
3. Multiple Aggregations: Revenue AND Count
One value at a time is useful, but often you want two numbers per cell: the sum AND the count. "How much revenue, and how many transactions?"
Use aggfunc as a dictionary mapping columns to functions.
The result is a two-level column table: the top level is the column name (gross_amount, settlement_id), and the second level is the payment_method (UPI, Card, etc.).
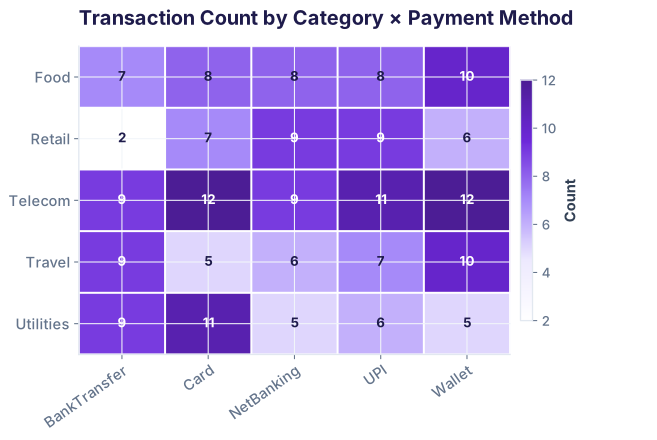
pivot_multi['gross_amount']['UPI'] gives you the revenue column for UPI. pivot_multi['settlement_id']['Card'] gives you the transaction count for Card. This structure is powerful for side-by-side comparisons.
4. margins=True: Row and Column Totals
Adding one parameter gives you subtotals and grand totals. Set margins=True.
5. crosstab(): Frequency Counts (Not Sums)
crosstab() is a specialized pivot table for counting. Instead of summing revenue, you count how many transactions occur at each intersection.
Typical use: "How many settlements happened in each city × payment method combination?"
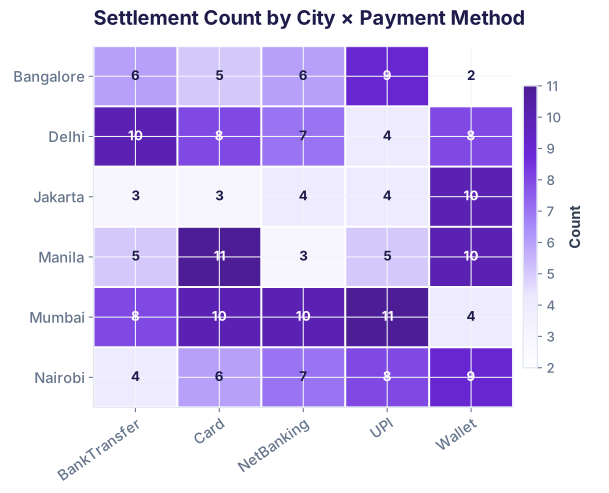
6. Normalizing Crosstabs: Rows vs. Columns vs. All
Raw counts are useful, but percentages often tell a clearer story. "What percentage of BankTransfer transactions come from Mumbai?" (row-wise) vs. "What percentage of Mumbai transactions use BankTransfer?" (column-wise).
Add normalize parameter to crosstab():
What each tells you:
"What % of Mumbai's transactions use each method?"
| City | UPI | Card | Wallet |
|---|---|---|---|
| Mumbai | 12.5% | 16.1% | 22.3% |
| Bangalore | 14.3% | 17.6% | 22.7% |
| Nairobi | 17.9% | 23.2% | 20.5% |
Each row sums to 100%. Read rows to compare method adoption across cities.
"What % of Card transactions come from each city?"
| City | UPI | Card | Wallet |
|---|---|---|---|
| Mumbai | 21.2% | 19.3% | 28.6% |
| Bangalore | 25.8% | 22.5% | 30.9% |
| Nairobi | 30.3% | 27.9% | 26.1% |
Each column sums to 100%. Read columns to compare city contribution to each method.
"What % of ALL transactions are Mumbai–Card?"
| City | UPI | Card | Wallet |
|---|---|---|---|
| Mumbai | 5.1% | 6.5% | 8.1% |
| Bangalore | 6.2% | 7.6% | 8.3% |
| Nairobi | 7.2% | 9.4% | 7.5% |
Table sums to 100%. Each cell is its share of all transactions.
When to use which?
- Row normalization: "How do method preferences differ by city?" Compare across rows to spot geographic variation.
- Column normalization: "How is each method distributed geographically?" Compare down columns to spot concentration.
- All normalization: "What fraction of the overall business is this segment?" Answer when each cell is equally important.
pivot() and pivot_table()?margins=True add to a pivot table?normalize='index' and normalize='columns' in crosstab()?Pivot tables solve 80% of reporting questions
Join the Best AI Program: The AI-Era Analyst — 5 months, fully online, with placement assistance. Week 1 is free.
Explore The AI-Era Analyst →