
Aisha is a junior data analyst at an M-Pesa fintech startup in Nairobi. Her boss just said: "We want to roll out a retention campaign—loyalty rewards, win-back offers, the works. But budget is tight. Which merchants should we focus on?"
Aisha has 800 merchants, 90 days of transaction data (recency, frequency, spend), and one afternoon to segment them. She can't manually score each merchant. Instead, she uses RFM: compute a Recency score (low days = high score), Frequency score, and Monetary score, then combine them into segments. Champions get loyalty perks. At-Risk merchants get a discount. Hibernating merchants get skipped—too cold to warm up. In 30 minutes, she has a segmentation model and a slide showing which 97 Champions bring in 21% of total value.
- Understand why all three (Recency, Frequency, Monetary) matter
- Compute Recency from date columns:
(today - date).dt.days - Score each metric with
pd.qcut()to create quartiles - Combine scores into segment labels (Champions, Loyal, At Risk, etc.)
- Visualize segment distribution and value concentration
- Design action plans for each segment
What is RFM?
RFM segmentation divides your customers into groups based on three simple metrics:
- Recency (R): How many days since their last transaction? Recent customers are more likely to buy again.
- Frequency (F): How many transactions in the last 90 days? Frequent buyers are more loyal.
- Monetary (M): Total spend in the last 90 days? High-value customers drive revenue.
Why all three? Because a one-time big spender is not the same as a loyal small buyer. A merchant who spent KSh 500k six months ago (low R, low F) is different from one who spent KSh 5k last week (high R, low M). RFM forces you to look at the full picture.
Computing Recency, Frequency, Monetary
Start with a CSV of transaction data: merchant ID, date, amount. Then compute the three metrics.
The output shows the raw distributions—wide ranges, skewed (a few merchants with huge spend). Now visualize them.
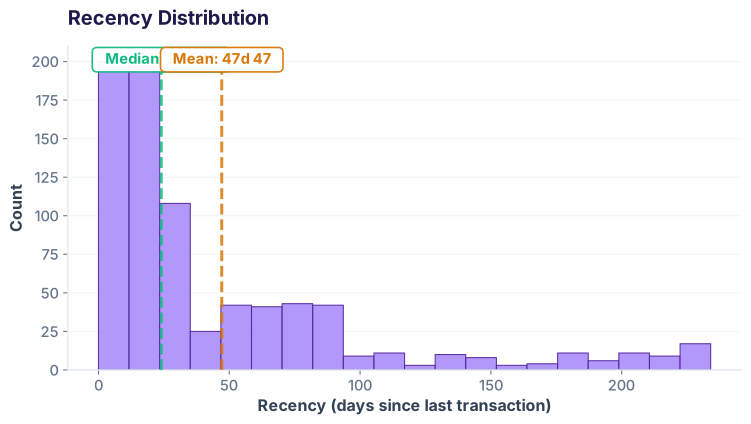
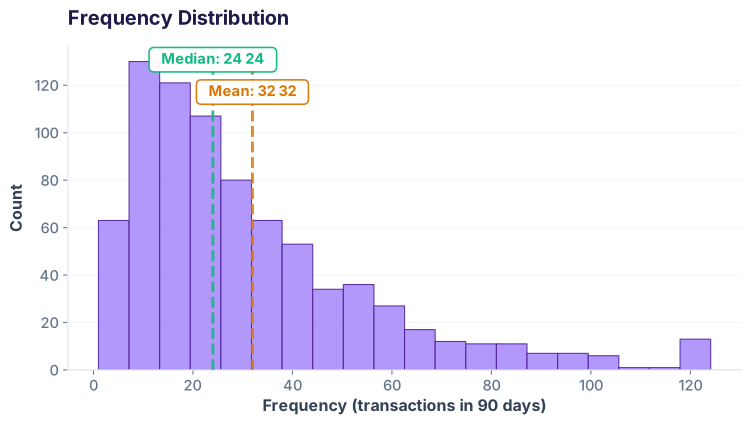
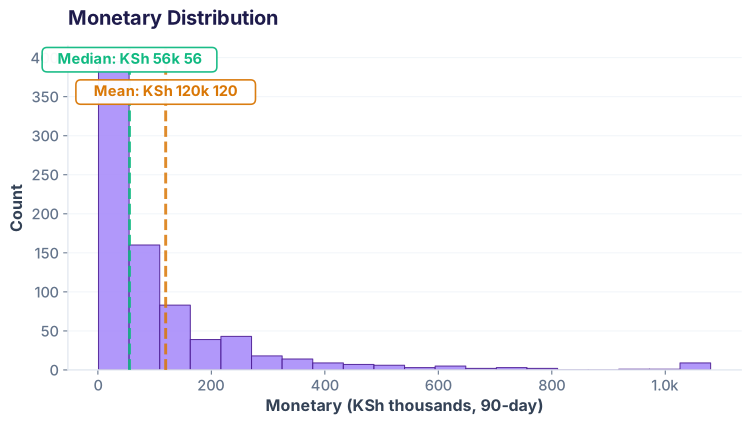
Scoring with pd.qcut: quartile-based binning
Raw RFM metrics are hard to compare (recency is in days, frequency is a count, monetary is currency). pd.qcut() divides each metric into quartiles and assigns a score 1–4. Higher is better for all three (but recency is reverse-scored: low days = high score).
Why pd.qcut and not pd.cut? Because pd.qcut creates equal-count bins (each quartile has ~25% of rows), while pd.cut creates equal-width bins. In RFM, you want all four bins to have similar population so your segments are actionable and sized fairly.
Combining scores into segment labels
Now that each merchant has an R, F, M score (each 1–4), combine them into business-meaningful segment labels.
Your segments now look like this:
| Segment | Count | Avg Recency (days) | Avg Frequency | Avg Monetary (KSh) | % of Total Value |
|---|---|---|---|---|---|
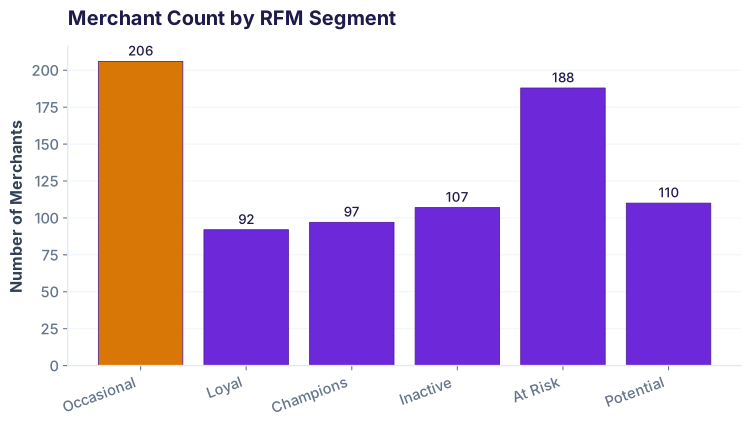
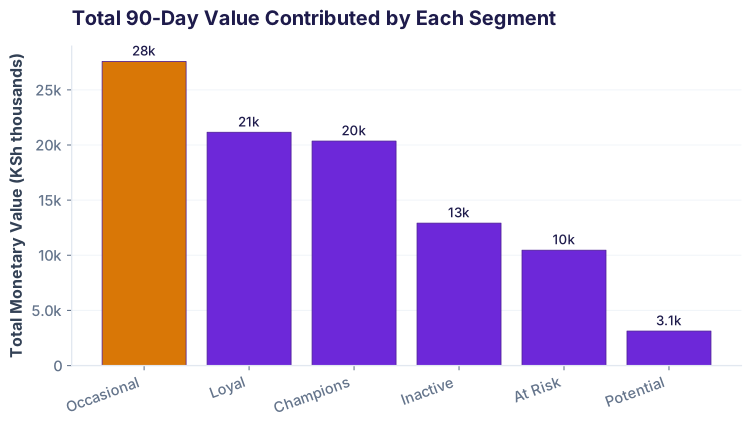
| Occasional | 206 | 12 | 14 | 133,890 | 28.8% |
| At Risk | 188 | 86 | 34 | 55,662 | 10.9% |
| Potential | 110 | 11 | 50 | 28,445 | 3.3% |
| Inactive | 107 | 81 | 10 | 120,733 | 13.5% |
| Champions | 97 | 12 | 49 | 209,853 | 21.3% |
| Loyal | 92 | 87 | 55 | 229,986 | 22.1% |
Visualizing segments: distribution and value concentration
Plots reveal actionable insights that numbers alone can't.
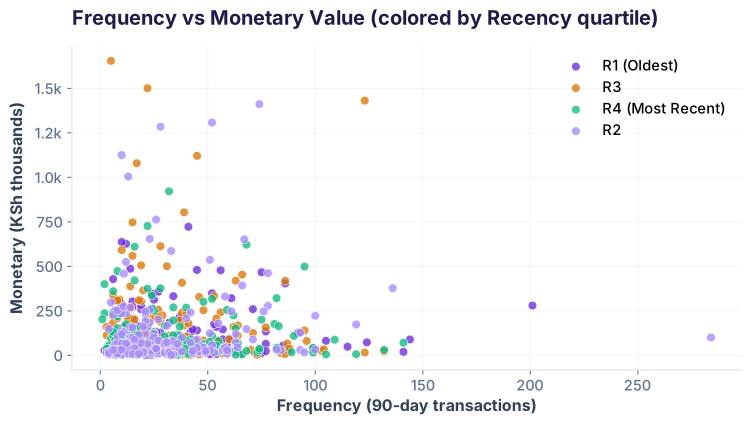
Acting on segments: design retention campaigns
RFM scoring is worthless without action. Here's how to design retention campaigns for each segment:
Champions (97 merchants, 21% of value)
Strategy: Loyalty & VIP treatment. These merchants are your bread and butter.
- Action: Loyalty rewards (fee rebates, priority support, early access to new features)
- Frequency: Monthly engagement (newsletters, exclusive product launches)
- Goal: Prevent churn; increase wallet share
Loyal (92 merchants, 22% of value)
Strategy: Reactivation. They used to be frequent; bring them back.
- Action: "We miss you" email + 10% discount on next 5 transactions
- Frequency: One-time burst campaign, then monitor
- Goal: Re-engage lapsed high-value customers
Occasional (206 merchants, 29% of value)
Strategy: Growth. Recent, but low-frequency. Turn them into repeaters.
- Action: Onboarding sequence (feature education, use-case guides)
- Frequency: Bi-weekly tips + product announcements
- Goal: Increase frequency (most impactful lever for this segment)
At Risk (188 merchants, 11% of value)
Strategy: Win-back. They're fading; act before they leave.
- Action: Urgent discount (15–20%), survey about friction, priority support
- Frequency: Urgent (today if possible)
- Goal: Stop the bleed; understand why they've gone quiet
Potential (110 merchants, 3% of value)
Strategy: Monetization. Recent & frequent, but low spend. Upsell.
- Action: Feature showcase (premium offerings, higher-value use cases)
- Frequency: Monthly feature briefing
- Goal: Increase average transaction size
Inactive (107 merchants, 14% of value)
Strategy: Retire (or deep reactivation). Low recency + low frequency. Not worth near-term spend.
- Action: Archive or 1x per quarter "come back" email
- Frequency: Quarterly at most
- Goal: Minimize support cost; detect if they suddenly re-engage
Ready to go further?
Join the Best AI Program: The AI-Era Analyst — 5 months, fully online, with placement assistance. Week 1 is free.
Explore The AI-Era Analyst →