
You're the only analyst at M-KOPA Solar, a fast-growing fintech doing solar-powered loans across Kenya. Every Monday, your manager asks: "How's the portfolio?—default rate, disbursals, which counties are struggling?" You've built a Jupyter notebook that reads 4,000 loan records and spits out tables and charts. But rerunning it manually takes 20 minutes, and sharing results means emailing screenshots. You need a dashboard the leadership team can bookmark and check anytime, from any device.
Why Streamlit? Speed over scaffolding
Streamlit lets you build web dashboards using Python alone. No HTML, no CSS, no JavaScript. Write st.title(), st.metric(), st.plotly_chart()—and the browser renders interactivity for free.
| Tool | Code needed | Best for | Deployment |
|---|---|---|---|
| Jupyter Notebook | Python + Markdown | Exploratory analysis (not dashboards) | Manual share (cells don't auto-update) |
| Tableau / Power BI | No code (drag-drop) | Enterprise reports with shared data sources | Expensive licenses + server costs |
| Flask / Django | Python + HTML + CSS + JavaScript | Full-featured web apps with auth, databases | Requires DevOps (AWS, Heroku, etc.) |
| Streamlit | Python only (no web framework) | Data dashboards, rapid prototyping, internal tools | Free tier on Streamlit Cloud (1 click) |
The pattern: Use Streamlit when you have a notebook and a deadline. You'll deploy a dashboard in hours, not weeks.
Install & hello world
Streamlit is a pip package. In 3 lines, you'll have an app running locally.
app.py and run streamlit run app.py. Streamlit opens a browser tab automatically.That's it. Streamlit reloads the app in the browser every time you save the file. No server restart needed.
Layout building blocks: KPIs, headers, and metrics
A dashboard needs hierarchy. Streamlit provides st.title(), st.header(), st.metric(), and st.divider() for structure:
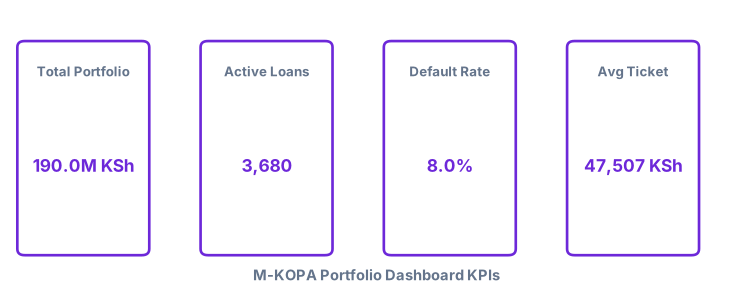
st.columns(4) creates a row of 4 equal-width containers. with col1: switches context—everything after it appears in that column. st.metric() renders a big, bold number perfect for dashboards.
Embedding charts: Seaborn, Plotly, and st.pyplot
Streamlit handles matplotlib (Seaborn) via st.pyplot() and Plotly via st.plotly_chart(). Both are one-liners:
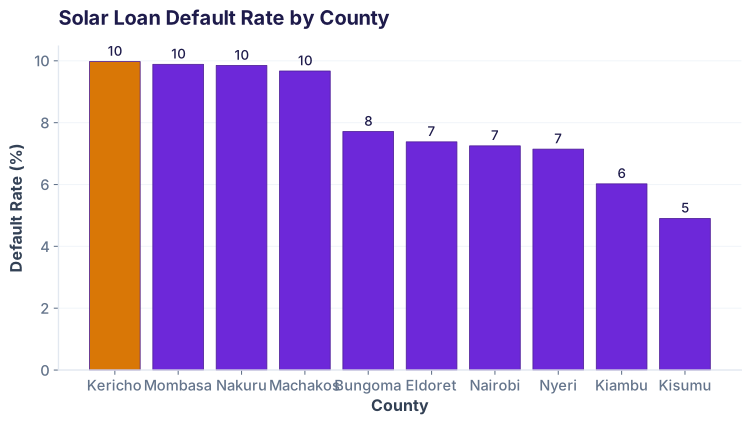
st.plotly_chart() is interactive—users can hover for values, click legends to toggle series, and zoom. Seaborn (matplotlib) charts are static, rendered as PNG images.
Caching: Stop reloading the CSV on every keystroke
By default, Streamlit reruns your entire script every time a user interacts with a widget. If you're loading a 100MB CSV, that's slow. Decorate your data-loading function with @st.cache_data to memoize it:
@st.cache_data stores the DataFrame in memory. Next run, Streamlit skips the load_data() call and returns the cached result instantly. If the file changes on disk, Streamlit auto-detects and recaches.
Advanced layout with st.columns and st.tabs
For richer layouts, use st.columns() to create grids, or st.tabs() to organize content into tabs. This is how you mimic a professional dashboard:
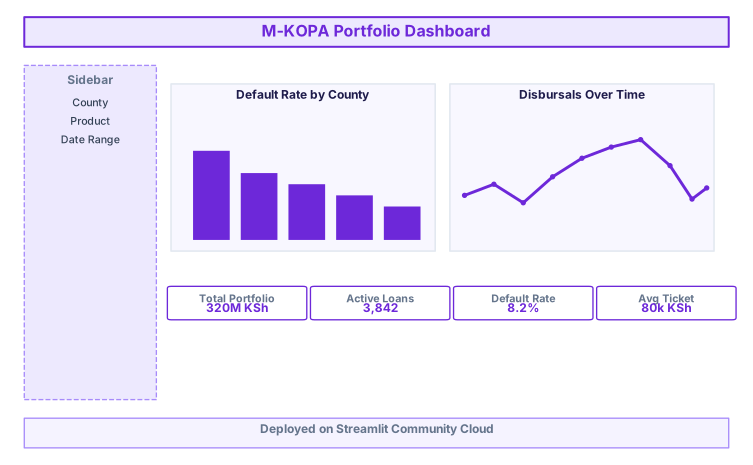
Deploy to Streamlit Community Cloud: One-click sharing
Once your app works locally, deploy it free on Streamlit Community Cloud. Leadership gets a URL they can bookmark.
Step 1: Prepare your repo
Push your code to GitHub:
git add app.py mkopa_portfolio.csv requirements.txt
git commit -m "Initial dashboard"
git remote add origin [your GitHub repo]
git push -u origin main
Step 2: Create requirements.txt
Streamlit Cloud reads this to install dependencies:
Step 3: Connect Streamlit Cloud
Go to share.streamlit.io, sign in with GitHub, and click "New app". Select your repo, branch, and app.py. Streamlit deploys automatically and gives you a live URL.
Common pitfalls & how to avoid them
Pitfall 1: Widget state resets on rerun
When a user selects a filter, Streamlit reruns the script. If you have count = 0 at the top, it resets to 0. Use st.session_state to persist values:
Pitfall 2: Widget keys colliding
If you loop over items and create widgets without unique keys, Streamlit will error. Always use a key:
Pitfall 3: Loading large CSV every time
Use @st.cache_data (covered earlier). Without it, a 100MB CSV reloads on every keystroke, causing lag.
Streamlit API cheatsheet
| Function | Use case | Example |
|---|---|---|
st.title() |
Page title (h1) | st.title('Dashboard') |
st.header() |
Section heading (h2) | st.header('Metrics') |
st.subheader() |
Sub-heading (h3) | st.subheader('By County') |
st.write() |
Generic output (text, df, chart) | st.write(df) |
st.metric() |
KPI card (big number + label) | st.metric('Active', '3,680') |
st.dataframe() |
Interactive table (sortable, searchable) | st.dataframe(df) |
st.matplotlib() |
Seaborn / matplotlib charts | st.pyplot(fig) |
st.plotly_chart() |
Plotly interactive charts | st.plotly_chart(fig) |
st.columns(n) |
n-column layout | col1, col2 = st.columns(2) |
st.tabs() |
Tabbed interface | tab1, tab2 = st.tabs(['A', 'B']) |
st.sidebar.selectbox() |
Dropdown in sidebar | st.sidebar.selectbox('County', df['county'].unique()) |
st.sidebar.multiselect() |
Multi-select in sidebar | st.sidebar.multiselect('Products', products) |
st.sidebar.date_input() |
Date picker in sidebar | st.sidebar.date_input('Start') |
@st.cache_data |
Memoize function (cache between reruns) | @st.cache_data |
@st.cache_data do?You've mastered dashboards.
Now deploy to production.
Join the Best AI Program: The AI-Era Analyst — 5 months, fully online, with placement assistance. Week 1 is free.
Explore The AI-Era Analyst →