
Arjun switched careers last year and now works nights on side projects while his family sleeps. He just landed a data role at SouthBank India in Hyderabad. On his first Monday, his manager hands him a CSV file with 8 days of branch transactions and asks: "Which branch is our star performer?"
Arjun opens the CSV. He sees 48 rows of raw data—dates, amounts, branch names. To answer the question, he needs to go from this messy table to a clear insight. This journey—from raw data to answer—is what data analysis is.
Data analysis in one picture
Here's what Arjun's workflow looks like: messy rows on the left, insights on the right.
| date | branch | amount |
|---|---|---|
| 2026-04-01 | Hyderabad | ₹12,400 |
| 2026-04-01 | Bangalore | ₹8,900 |
| 2026-04-02 | Chennai | ₹15,200 |
| 2026-04-02 | Hyderabad | ₹18,600 |
| 2026-04-03 | Mumbai | ₹9,800 |
| 2026-04-03 | Hyderabad | ₹22,100 |
| 2026-04-04 | Delhi | ₹11,500 |
| 2026-04-04 | Hyderabad | ₹16,800 |
This is data analysis: turning the left side into the right side. No coding yet—just the idea.
The 5-step analyst workflow
Every analysis follows this path. Let's walk through each step with Arjun's branch question.
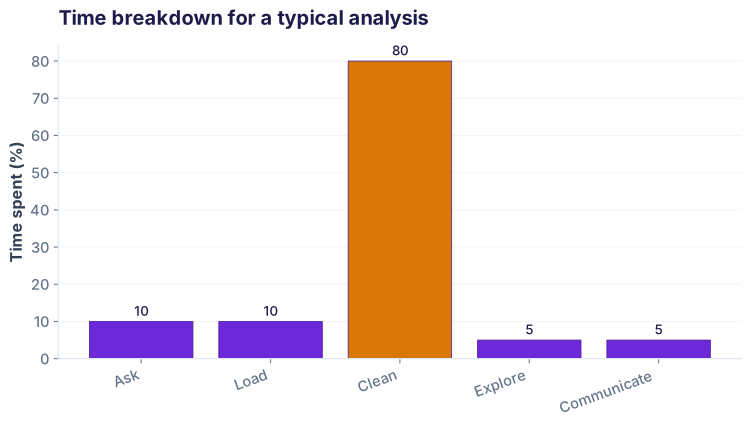
Here's the reality: cleaning (Step 3) takes 80% of your time. You'll spend one day asking questions and four days fighting dirty data. This is normal.
Tools analysts use
You don't need many tools. Start with these five.
| Tool | What it does | When to use it |
|---|---|---|
| pandas | Load, clean, group, filter data | Your main workhorse. 80% of your time. |
| matplotlib / seaborn | Draw charts (line, bar, scatter, histogram) | When you're ready to visualize. |
| SQL | Query databases (PostgreSQL, MySQL, etc.) | When data lives in a database, not a CSV. |
| Excel / Google Sheets | Quick summaries, pivot tables, sharing | For non-technical stakeholders. Fast but not scalable. |
| Jupyter Notebook | Interactive coding environment (Python + markdown + charts) | Your main editor. Code + notes + results in one place. |
Your first mini-analysis: 3 steps
Let's solve Arjun's problem with real code. We'll load the branch data, calculate totals, and draw a chart. Three Python blocks, three outputs.
Step 1: Load and preview the data
First, read the CSV file and see what you're working with.
pd.read_csv() and peeked at the first 5 rows with .head(). Now we know the columns: date, branch, amount. All numeric—no typos, no blanks. Lucky us.
Step 2: Group by branch and sum
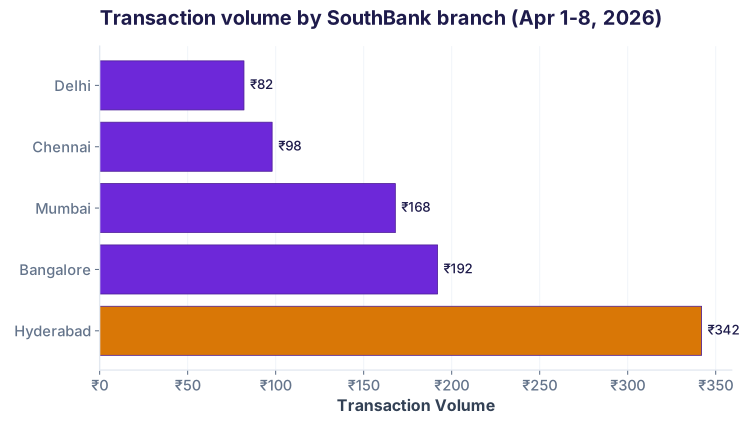
Group all transactions by branch, then sum the amounts. This answers: which branch has the highest total volume?
Step 3: Draw a horizontal bar chart
A chart tells the story better than a table. Let's visualize the branch volumes side-by-side.
What this track will teach you
Lesson 01 is the foundation. The rest of the 29-lesson track builds on these five steps, with deeper tools and real-world scenarios.
- Arc 1: Foundations — Learn pandas, Jupyter, the workflow
- Arc 2: Load — CSV, Excel, JSON, APIs, SQL, Parquet
- Arc 3: Clean — Nulls, duplicates, types, regex, outliers
- Arc 4: Explore — Descriptive stats, groupby, pivot, joins, time-series
- Arc 5: Analyse — Correlation, regression, distributions, cohort, funnel, RFM, A/B tests
- Arc 6: Visualise & Ship — Matplotlib, Seaborn, Streamlit dashboards, reports
Where you see this
Industries & use cases
How this connects to AI
Every machine learning model starts as a data analysis project. Before you train a fraud detector or predict churn, you must understand your data—group it, visualize it, find patterns. This lesson is where AI people start. Clean data + clear questions = AI success.
Mini Challenge
Task: You have the same SouthBank transactions CSV. Calculate how many transactions each branch handled. Which branch processed the most txns (not the highest volume)? Use .groupby().size() to count rows per branch.
df.groupby('branch').size().sort_values(ascending=False) will count txns per branch and show the highest first.
Interview questions
Test your knowledge
df.groupby('branch')['amount'].sum() do?Cheatsheet: Data analysis foundations
| Concept | What it is | Example |
|---|---|---|
| 5-step workflow | Ask → Load → Clean → Explore → Communicate | Question: which branch is top? Answer: a bar chart. |
| Data cleaning | Fixing typos, blanks, dates, duplicates | Replace "Hyd" with "Hyderabad", drop empty rows |
| Groupby | Group rows by category, then aggregate | df.groupby('branch')['amount'].sum() |
| Data visualization | Turn numbers into charts | Horizontal bar, line, scatter, histogram |
| EDA | Exploratory Data Analysis—asking questions of data | How many txns per branch? Which day is busiest? |
| Pandas | Python library for data manipulation | pd.read_csv(), .groupby(), .describe() |
| Matplotlib/Seaborn | Python libraries for charting | .plot.barh(), .plot.line(), sns.heatmap() |
| SQL | Query language for databases | SELECT branch, SUM(amount) FROM txns GROUP BY branch |
| Jupyter Notebook | Interactive Python editor (code + notes + charts) | Write code, see output, add markdown notes |
| CSV file | Plain text table (comma-separated values) | transactions.csv with date, branch, amount columns |
Common pitfalls
df.info(), df.describe(), df.isnull().sum().Ready to dive in?
Join the Best AI Program: The AI-Era Analyst — 5 months, fully online, with placement assistance. Week 1 is free.
Explore The AI-Era Analyst →