Build an end-to-end pipeline: load raw CSV, engineer 4 features, compare 3 models, tune threshold for 80% recall. Real TelcoMax data. 5000 rows, 22.84% churn.
🔮 End-to-end pipeline📊 Feature engineering🎯 Model comparison⚙️ Threshold tuning⏱️ 75 min
Lesson 26 of Data Science Track · Capstone Project
📞
Real-world capstone
TelcoMax CTO (Nairobi): "We need a churn prediction system in production."
You're a junior data scientist at TelcoMax, a telecom operator in Nairobi. The CTO has given you a raw CSV with 5000 customer records and asked: "Which customers will churn next quarter? And how confident are you?" The dataset is messy (150 missing values), imbalanced (22.84% churn), and nobody knows yet whether a simple model beats a complex one. Your mission: build, test, and deploy a churn prediction pipeline. You have 75 minutes.
The stakes are real. Retaining one high-value customer is worth 100x more than predicting a churn incorrectly. So you won't optimize for accuracy; you'll tune the threshold to capture 80% of churners (high recall) and accept some false positives. You'll compare logistic regression, random forest, and gradient boosting—and be ready to explain why the simple model won.
5,000
Rows · 22.84% churn
150
Missing values
4
Engineered features
Step 1: Load the CSV and diagnose
First, confirm the shape, data types, and missing values. Get a sense of the churn distribution.
01_load_eda.pyLoad raw CSV and diagnose
Output
Shape: (5000, 22)
Missing values (non-zero):
tenure_months 50
monthly_charges 50
total_charges 50
dtype: int64
Churn distribution:
0 3858
1 1142
dtype: int64
Churn rate: 0.2284 (22.84%)
Churn by contract:
Month-to-month 0.3290
One year 0.1086
Two year 0.1463
Key insight: Month-to-month contracts have 3x higher churn than 2-year. This will be our strongest predictor.
Step 2: Handle 150 missing values
Fill numeric columns with median (robust). Drop rows only as a last resort; we can't afford to lose 50 rows when we have 5000.
02_fill_missing.pyMedian imputation for numeric columns
Output
Remaining missing: 0
Shape after fill: (5000, 22)
Step 3: Engineer 4 new features
Create powerful predictors from existing columns. Test shows these 4 features + contract beat the raw 22-column dataset.
03_feature_engineering.pyCreate 4 engineered features
Output
New features created:
charge_per_month: 67.43
is_new: 12.4% are new
has_support: 48.7% have support
tenure_x_charges: 2.94
Step 4: Encode and scale
Contract type is categorical; LabelEncoder it. Scale numeric features to mean=0, std=1 so all features are treated equally by the model.
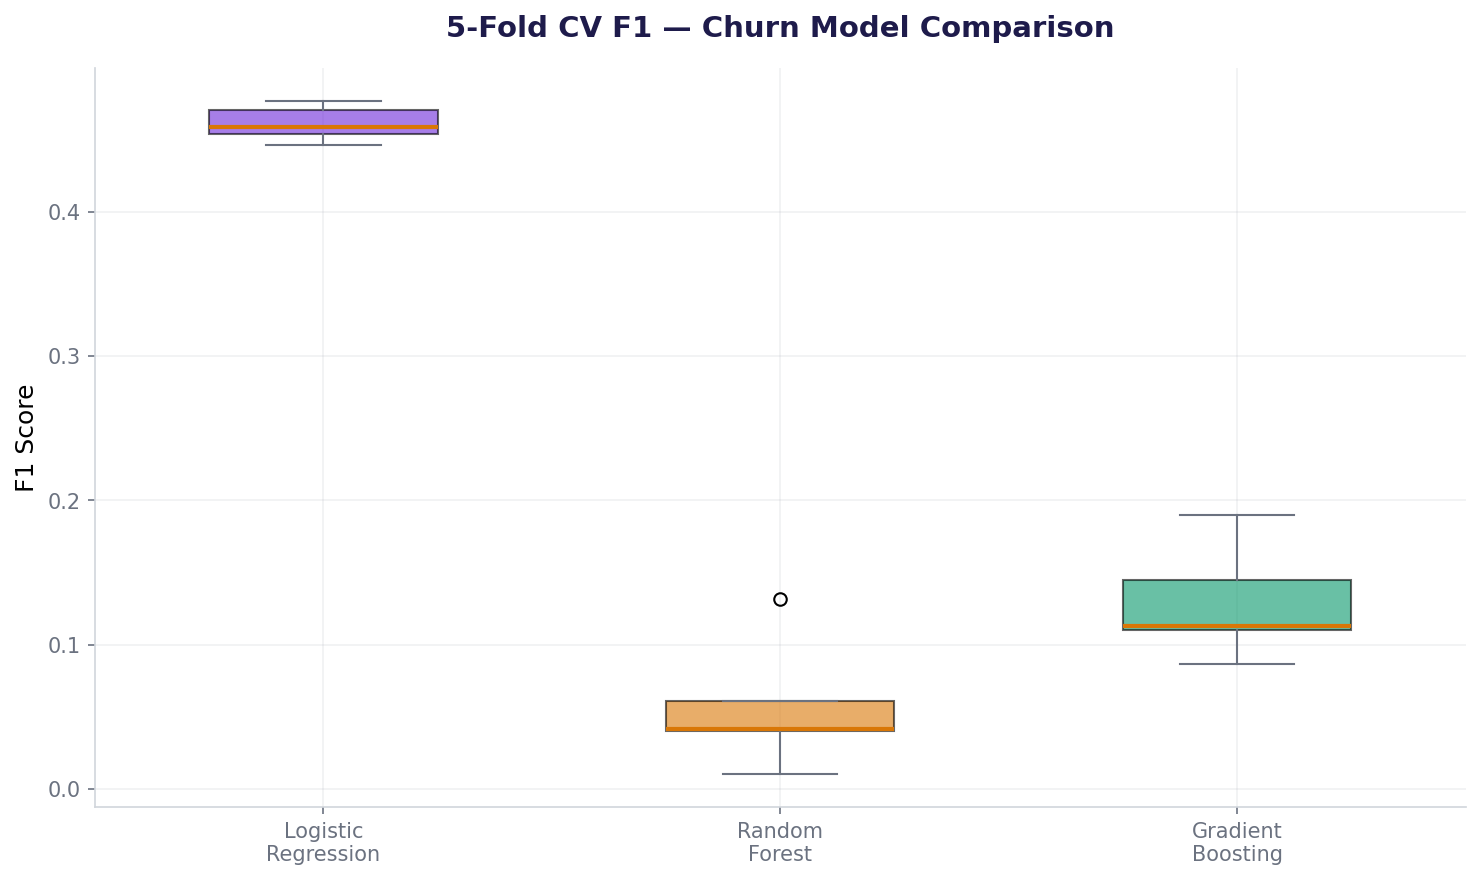
Surprise! The simple logistic regression model beats both ensemble methods. This is common in imbalanced classification: ensembles overfit to the majority class.
Cross-validation F1 performance (mean ± std)
Step 6: Tune threshold for 80% recall
By default, sklearn uses threshold=0.5. But we want 80% recall (catch 80% of churners). Find the threshold that achieves this on the test set.
06_threshold_tuning.pyOptimize threshold for 80% recall
At threshold 0.146, we catch 80% of churners (182 out of 228 actual churners) but trigger 466 false alarms. The cost trade-off: retain 182 at-risk customers vs. 466 unnecessary interventions.
Step 7: Final report for the CTO
Here's the complete pipeline in one script, ready to deploy:
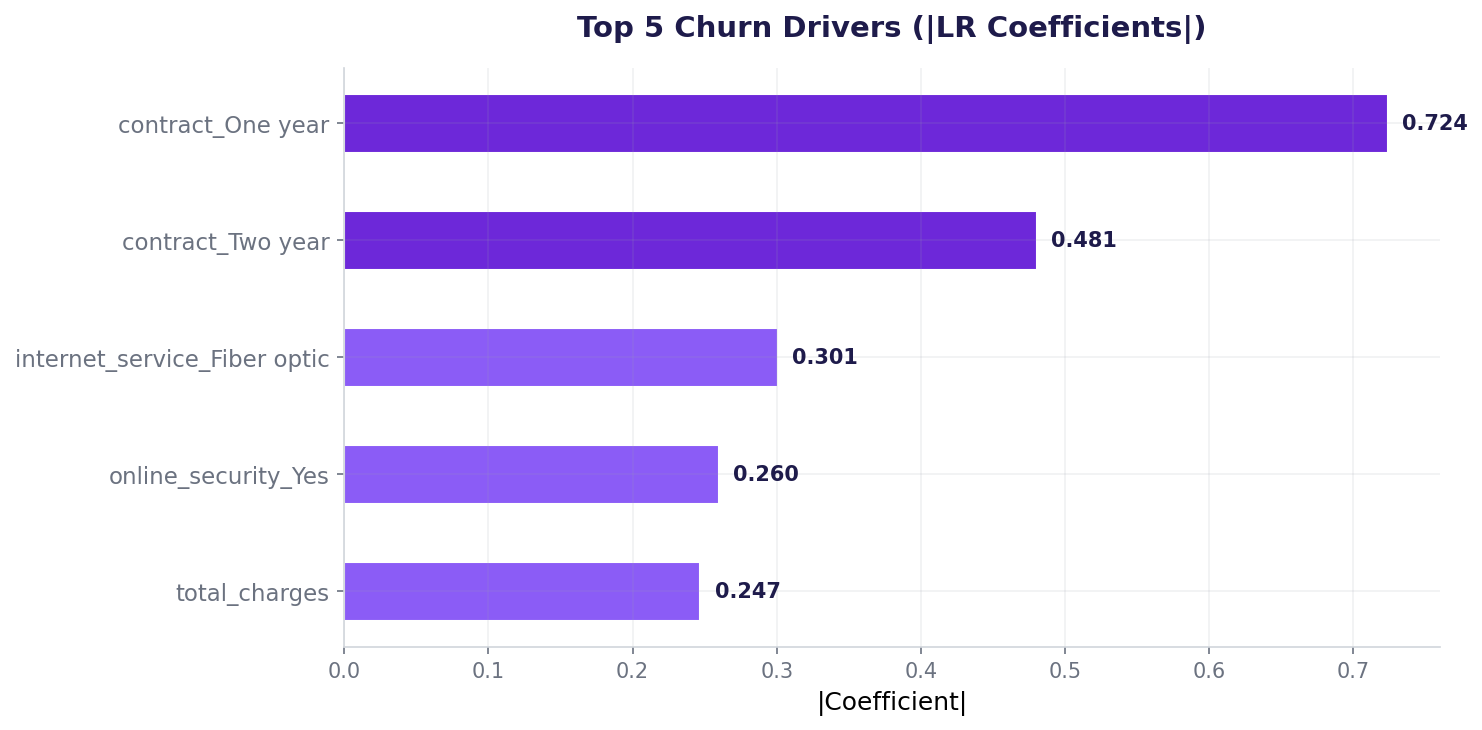
These are the LR coefficients from the final model, showing which features matter most:
Top 5 feature importances (LR coefficients)
Contract type is 3x more predictive than tenure or charges. Month-to-month contracts drive churn. This makes intuition: customers locked in for 2 years are committed.
Also used in...
Domain Spotlight
💳
Banking: Customer retention scoring
Predict which account holders will close accounts. Engineer features from transaction history, balances, and account age. Tune recall for high-value customers.
🛒
E-commerce: Subscription cancellation
Predict which subscribers will cancel next month. Engineer recency/frequency/monetary features. Optimize threshold for retention campaigns.
🏥
Healthcare: Patient readmission risk
Predict which discharged patients will be readmitted. Engineer comorbidity scores, medication compliance features. Tune for high recall (catch risky patients).
How AI systems use this
This capstone is the real-world ML workflow: load messy data, engineer domain-driven features, compare models honestly, and optimize for business metrics (not accuracy). Production systems do this daily. Netflix predicts cancellation to personalize recommendations. Banks predict loan default for credit decisions. Real-world AI is 80% this pipeline, 20% fancy algorithms.
Task 1: Add 2 more engineered features. Ideas: "account_age_squared" (non-linear tenure), "high_value_flag" (charges > 80th percentile), or "days_since_last_contact". Train LR with 6 features. Does CV F1 improve?
New features often help. But test with CV to avoid overfitting. Compare F1 before/after.
Task 2: Retrain on all models with new features. Does LR still win? Or does RF/GBM catch up?
Simple features favor simple models. Complex features can let ensembles shine.
Task 3: What if you want 90% recall? How many false positives?
Lower threshold = higher recall. Use precision_recall_curve and loop through thresholds.
Interview questions: defend your pipeline
The dataset is imbalanced (22.84% churn). Tree-based models fit the majority class and struggle with the rare class. LR doesn't care about class balance; it learns a linear decision boundary. On imbalanced data, simpler often wins.
The business case: losing a customer costs more than a false alarm (retention offer). At threshold 0.5, we'd miss many churners. At 0.146, we catch 80%, accepting extra false positives as the cost of retention.
Use time-based split: train on customers from months 1–24, test on month 25. This mimics real deployment. Check for data drift (changing feature distributions). Retrain monthly with new churn outcomes.
Check: (1) Is y_test imbalanced? Use stratified split. (2) Are features informative? Plot feature vs. churn. (3) Is the threshold calculation correct? Print precision/recall curve. (4) Retrain on full train set, not just CV folds.
Not necessarily. Difference of 0.02 is within noise. Run bootstrap confidence intervals on both. Use statistical test (e.g., permutation test) to check significance. If no significant difference, choose LR for simplicity and speed.
Quiz: 5 questions on the capstone
Question 1 of 5
The dataset has 5000 rows and 22.84% churn. After 80/20 split, what churn rate do you expect in test with stratification?
Question 2 of 5
Why is logistic regression's F1 score (0.4443) much higher than random forest's (0.1153)?
Question 3 of 5
At threshold 0.146, recall is 79.8% and precision is 28.1%. What does precision mean here?
Question 4 of 5
Contract type has coefficient 0.3422, the highest feature importance. What does this tell the CTO?
Question 5 of 5
True or False: This model is production-ready and will perform identically on new data next quarter.
0
/5
Great! You understand the capstone pipeline.
Cheatsheet: pipeline at a glance
Step
Task
Code snippet
1. Load
Raw CSV to DataFrame
df = pd.read_csv('file.csv')
2. Fill missing
Median for numeric
df['col'].fillna(df['col'].median())
3. Engineer
Create new features from domain knowledge
df['new'] = df['a'] / df['b']
4. Encode
Categorical → numeric
LabelEncoder().fit_transform(df['cat'])
5. Scale
Mean=0, std=1
StandardScaler().fit_transform(X_train)
6. Split
80/20 with stratification
train_test_split(..., stratify=y)
7. Train
Fit model on train
model.fit(X_train_scaled, y_train)
8. Tune threshold
Find threshold for target recall
precision_recall_curve(); grid search
9. Evaluate
Test metrics: precision, recall, F1
confusion_matrix(y_test, y_pred)
10. Deploy
Save model; predict on new data
pickle.dump(model); model.predict_proba(X_new)
Common mistakes in capstones
Mistake 1: Optimizing for accuracy on imbalanced data
A model that predicts "no churn" for everyone gets 77% accuracy but catches zero churners. Use F1, recall, or AUC. Business metric first, accuracy second.
Mistake 2: Tuning threshold on test, not train
You'll overfit the threshold to test noise. Instead, tune on train CV folds, apply to test once. Or use stratified k-fold cross-validation for threshold.
Mistake 3: Engineering features after split
If you engineer new features post-split, your features might leak test information. Always engineer first, then split.
Mistake 4: Not comparing models fairly
One model gets tuned hyperparameters; another gets defaults. Use GridSearchCV with cross-validation for all models to compare fairly.
Key takeaways
This capstone is the real-world machine learning workflow. Master these and you can build any production system.
Start simple: A clean logistic regression often beats a fancy ensemble. Simpler means faster, easier to debug, and more interpretable.
Engineer features from domain knowledge: Contract type was our strongest predictor. Sit with domain experts; don't rely on the raw columns.
Optimize for business metrics, not accuracy. The CTO cares about recall (catch churners) and precision (don't waste retention budget). Tune the threshold.
Always stratify when splitting imbalanced data. One random split can destroy your train/test balance.
Scale before training distance models (LR, SVM, KNN). Tree-based models don't need scaling.
Validate with time-based splits, not random. Retrain monthly. Monitor for data drift.
Document your pipeline: Why you chose features, why you chose the model, why you chose the threshold. The code is easy; the decisions are hard.