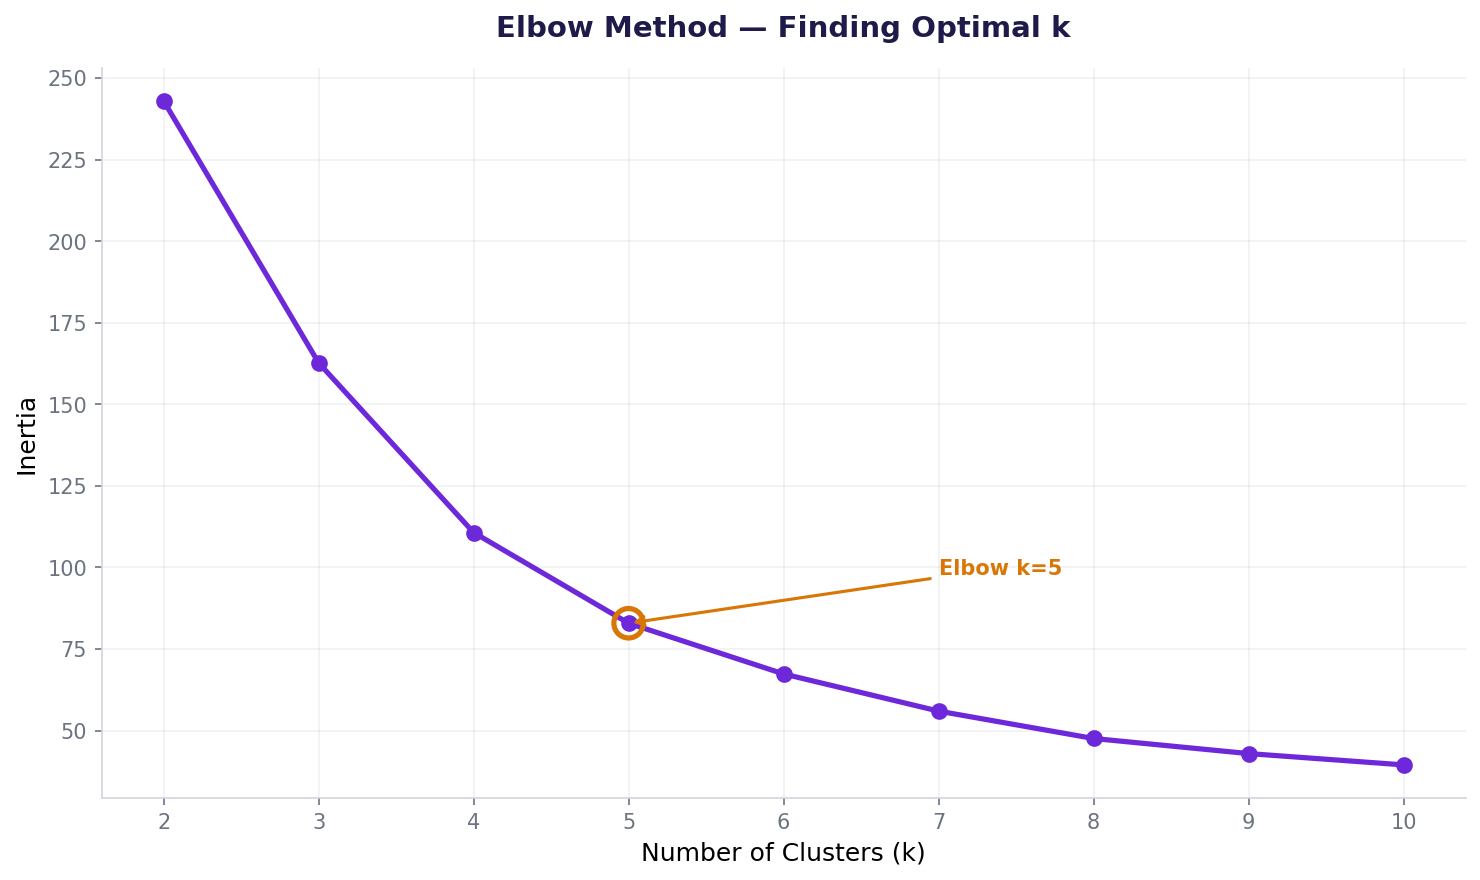
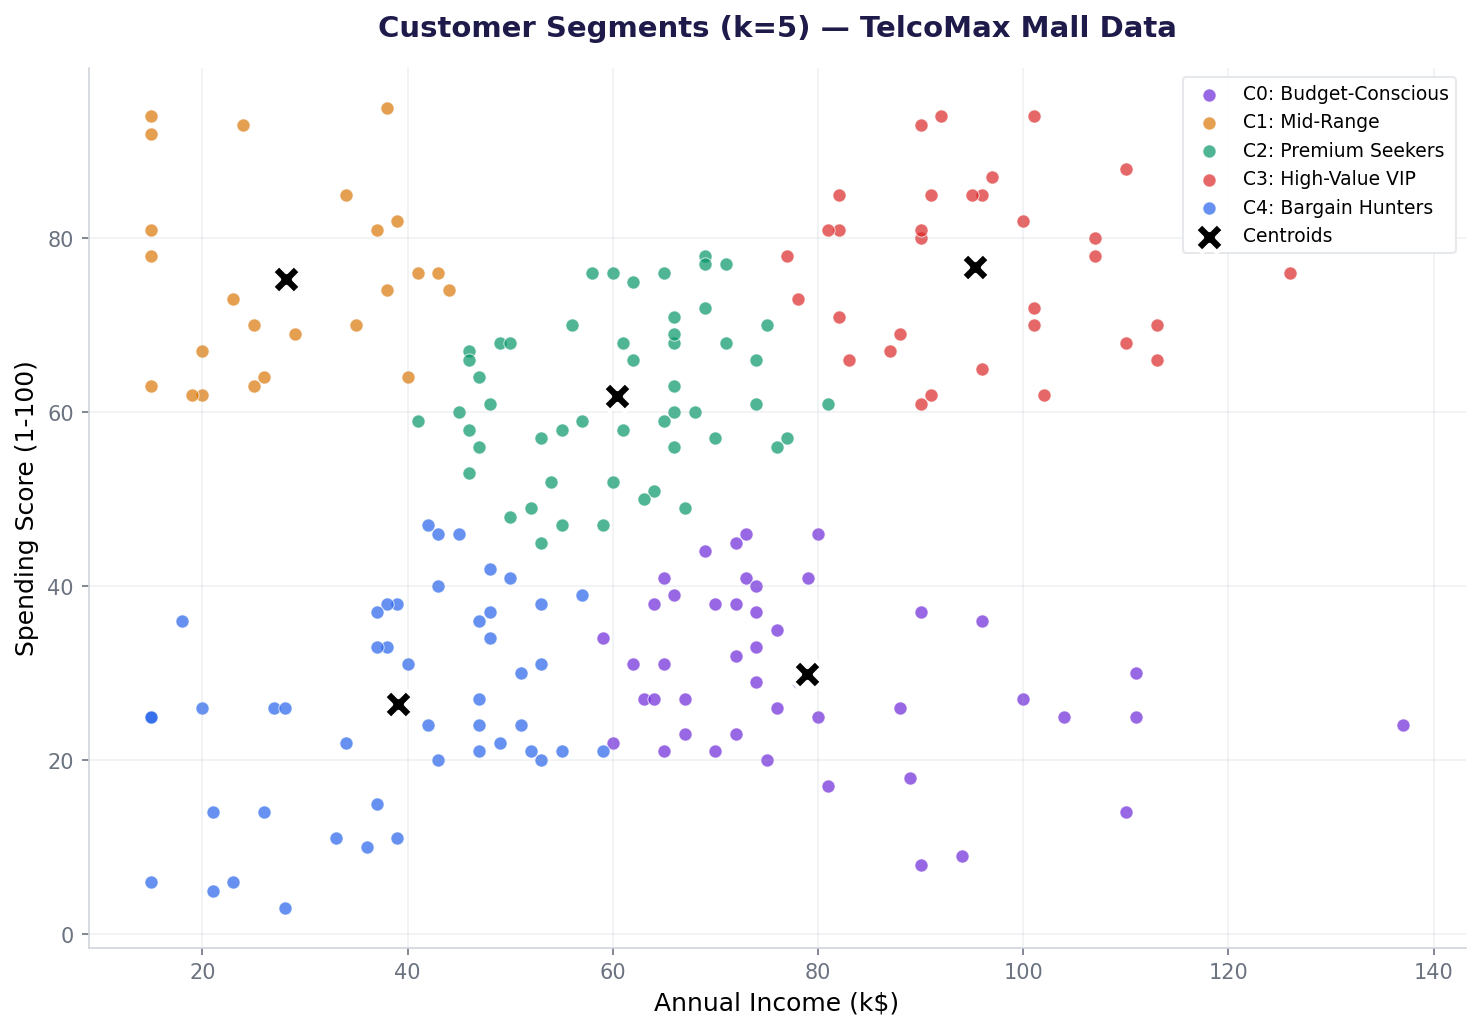
The CMO at TelcoMax (Nairobi) has data on 200 mall customers with three metrics: age, annual income (in thousands), and spending score (0-100). She wants customer groups to tailor marketing spend, product recommendations, and loyalty programs.
Your mission: load and explore. Scale features. Use elbow method and silhouette analysis to find optimal clusters. Fit KMeans, profile each segment by behavior, and produce marketing recommendations.
200
Customers
3
Features
5
Segments
Step 1: Load and explore the dataset
Start by loading the CSV and inspecting shape, data types, and summary statistics.
load_explore.pyLoad and describe mall customer data
Output
Shape: (200, 3)
First 5 rows:
age income_k spending_score
0 25 50 20
1 31 59 64
2 42 90 70
3 58 70 40
4 36 45 30
Data types:
age int64
income_k int64
spending_score int64
Basic stats:
age income_k spending_score
count 200 200 200
mean 42.6 59.8 50.9
std 14.6 26.2 25.1
min 18 15 5
max 70 137 99
Missing values: 0
Step 2: Scale features to mean=0, std=1
KMeans is distance-based. Age (18–70) and income (15–137K) are on different scales. Standardize all features so each contributes equally.
Each segment needs different strategies based on income, spending patterns, and age demographics.
Segment 0: Loyal Elders (Age 59, Income 68K, Spend 36) — Established customers, stable income, low engagement. Recommend: premium loyalty rewards, easier checkout, family bundle offers.
Segment 1: Young Actives (Age 31, Income 53K, Spend 64) — Growing spenders, moderate income, high engagement. Recommend: social media campaigns, trends-focused products, subscription models.
Segment 2: Premium (Age 42, Income 93K, Spend 72) — Top tier, high income and spending. Recommend: exclusive products, VIP events, personalized service.
Segment 3: Budget Conscious (Age 36, Income 48K, Spend 26) — Price-sensitive, low engagement. Recommend: discounts, bulk offers, value messaging.
Cluster customers by income, credit history, spending patterns. Offer tailored loan products and interest rates per segment.
🏥
Healthcare: Patient cohorts
Segment patients by age, BMI, comorbidities. Tailor treatment plans and prevention programs per cohort.
📱
Telecom: Subscriber segments
Cluster by usage patterns, churn risk, ARPU. Personalize retention campaigns and upsell bundles.
How AI systems use this
Every recommendation engine—Netflix, Spotify, Amazon—uses customer segmentation. Cluster users by taste, behavior, and demographics, then serve personalized content. LLMs use clustering to identify topic communities in text. Your segmentation pipeline is the foundation of personalization at scale.
Challenge: Extend segmentation to hierarchical clustering
Task: Apply hierarchical clustering (linkage='ward') to the same scaled data. Compare dendrogram to KMeans results. Are segment boundaries similar? Use scipy.cluster.hierarchy.dendrogram.
Hint: Import linkage, dendrogram from scipy.cluster.hierarchy. Fit with linkage(X_scaled, method='ward'), then plot dendrogram. Set truncate_mode='lastp' and p=10 for readability.
Interview questions: test your understanding
Use intrinsic metrics: silhouette score (how tight clusters are), inertia (sum of squared distances), or Davies-Bouldin index (cluster separation). No ground truth needed.
Check interpretability trade-off. If k=5 segments are meaningfully different and actionable, use k=5 even if silhouette is slightly lower. Metrics serve the business goal, not vice versa.
Use names (e.g., "Loyal Elders," "Premium") and simple 2D plots. Focus on actionable stats: "This segment is age 58 with 68K income and 36% spending. We recommend loyalty programs."
Scale the new customer using the fitted scaler. Call kmeans.predict() on the scaled features. This returns the nearest cluster center. Assign to that segment.
Quiz: 5 questions to test your knowledge
Question 1 of 5
Why must you scale features before KMeans?
Question 2 of 5
What does the elbow method measure?
Question 3 of 5
You have silhouette scores: k=3: 0.267, k=4: 0.290, k=5: 0.276, k=6: 0.291. What's the best k?
Question 4 of 5
After fitting KMeans on training data, how do you assign a new customer to a segment?
Question 5 of 5
Your "Budget Conscious" segment has age=36, income=48K, spend=26. What marketing action makes sense?
0
/5
Excellent! You master customer segmentation.
Cheatsheet: segmentation at a glance
Step
Code
Purpose
Scale
StandardScaler().fit_transform(X)
Mean=0, std=1 before clustering
Elbow
KMeans(n_clusters=k).inertia_
Plot inertia vs k; find elbow
Silhouette
silhouette_score(X, labels)
Score cluster quality (−1 to 1)
Fit
KMeans(n_clusters=k).fit_predict(X)
Train and assign labels
Profile
df.groupby('cluster').mean()
Describe each cluster
Predict
kmeans.predict(X_new_scaled)
Assign new point to cluster
Common mistakes: what breaks and how to fix it
Mistake 1: Forgetting to scale before KMeans
Age (18–70) dominates income (15–137) because of scale. Income and spending score get ignored. Fix: always use StandardScaler before KMeans.
Mistake 2: Picking k based on silhouette alone
Metrics are guides, not law. If k=5 is more interpretable than k=6 (even if silhouette is slightly lower), use k=5. Business needs matter.
Mistake 3: Not reusing the fitted scaler for new data
If you create a new scaler for new customers, they're scaled differently, and clusters won't match. Save the scaler with joblib, then reuse it.
Mistake 4: Ignoring cluster imbalance
If one cluster has 100 customers and another has 5, algorithms may bias toward the large cluster. Check cluster sizes and consider rebalancing.
Key takeaways
Customer segmentation is unsupervised learning: No labels. Use clusters to find natural groups.
Always scale before KMeans. Distance-based algorithms need equal-scale features.
Use elbow method + silhouette to choose k. Both are heuristics; combine with business judgment.
Profile segments by behavior, assign names, generate actions. "Segment 0" is meaningless; "Loyal Elders" is actionable.
Reuse the fitted scaler for prediction on new data. Never scale new customers with a new scaler.
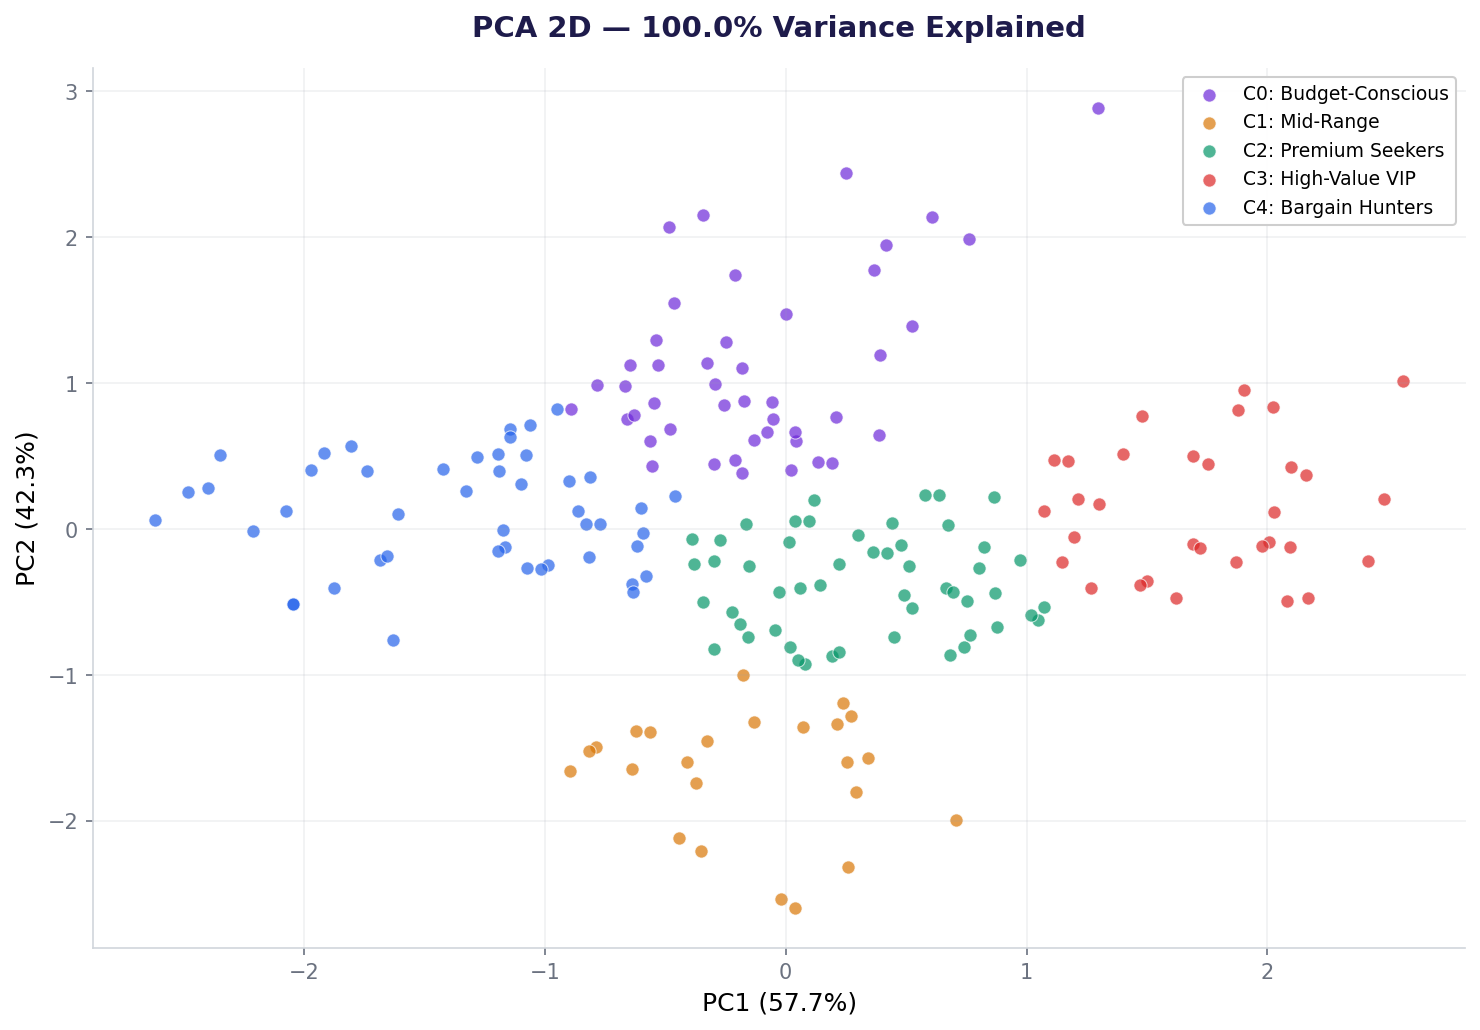
Validate with PCA visualization. 2D plots reveal separation, overlap, and outliers visually.