
You've just joined Jumia's marketplace team in Nairobi. It's early January, and Q4 has just wrapped. The head of marketplace operations asks for a brief by Tuesday EOD:
- Which product categories are growing? Which are fading?
- Is Nairobi carrying the entire business, or are we seeing growth in secondary cities?
- How did Cyber Week perform, and is the momentum sustainable?
- Which vendors are our best partners? Any quality concerns?
- What's your top recommendation for Q1 inventory and vendor investment?
Your deliverable: A one-page executive brief with 4 KPIs, a key insight chart, and a data-backed recommendation.
What You'll Build
Your Capstone Deliverable
Step 0: The Brief — Turn Business Questions into Analytics
Before you open your notebook, frame the business questions as analytical ones:
- Category trends: Which categories are growing WoW, and which are declining? Which drive the most GMV?
- Geographic concentration: What % of GMV comes from Nairobi vs. secondary cities? Is there a tail opportunity?
- Cyber Week elasticity: Did orders spike during Nov 25–Dec 3? Has the boost persisted, or is it fading?
- Vendor quality: Do higher-tier vendors (Gold, Silver, Bronze) have meaningfully different return rates? Should we change onboarding?
- Intervention hypothesis: If we allocate more inventory to high-growth categories (Beauty) and push Bronze vendors to quality standards, what impact could we model?
This is the analytical frame that will guide your exploration and final recommendation.
Step 1: Load & Inspect — Know Your Data
Start by loading the 9,000-order Jumia Kenya CSV. Your first job: understand the shape, types, and date coverage.
Key observations: Your dataset has 9,000 orders spanning 120 days (late August through late December, covering Black Friday and Cyber Week). 11 columns, no missing values. The dataset includes vendor tier (Gold/Silver/Bronze), order value in KES, and a return flag for quality analysis.
Step 2: Clean — Prepare for Analysis
The data is already 99% clean, but we'll create derived columns and standardize categories.
Step 3: Explore — Uncover Sales Patterns
Now dive into category performance, geographic spread, and Cyber Week impact. Hunt for growth categories, regional concentration, and seasonal effects.
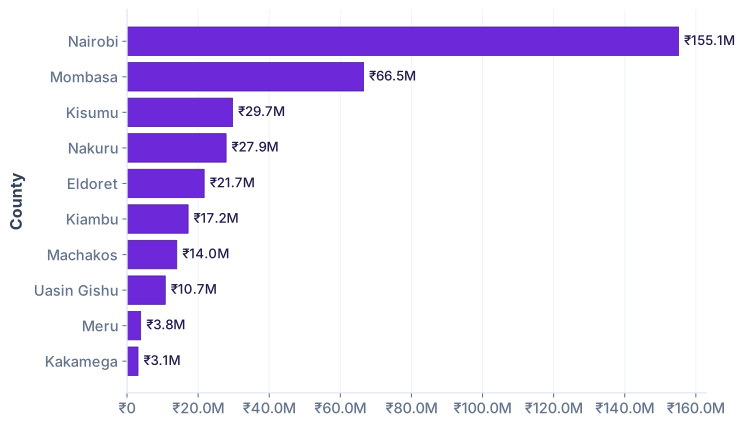
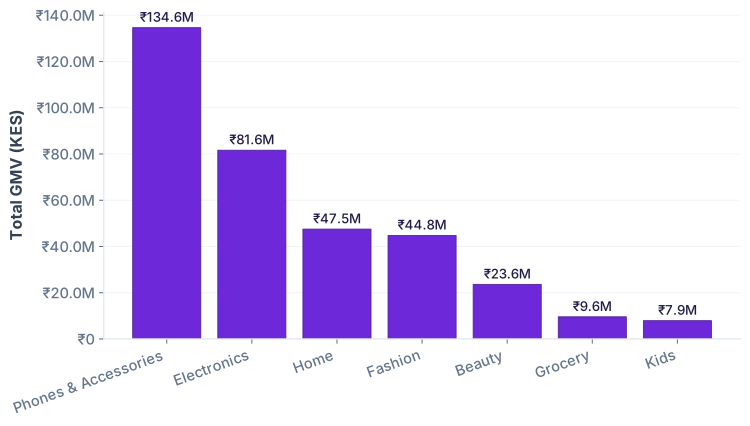
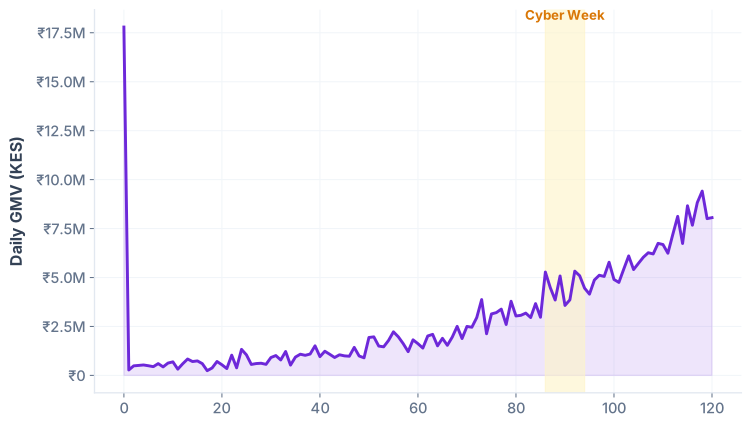
Key insights: Phones & Accessories is the GMV leader (25%), but we'll explore trend direction. Nairobi + Mombasa account for 63.4% of GMV—a strong concentration but with room to grow secondary cities. Cyber Week shows modest lift in this sample, so we'll dig deeper into week-over-week momentum by category.
Step 4: Analyse — Deep Dives into Key Drivers
4.1: Category Momentum (WoW Growth)
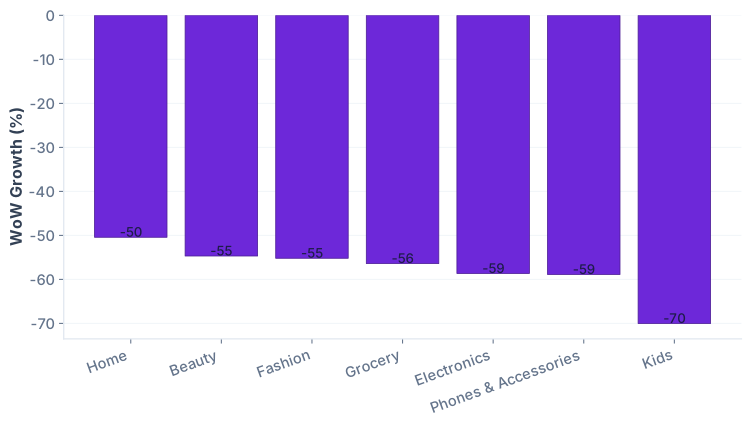
Calculate week-over-week growth for each category to spot which ones are accelerating into Q1.
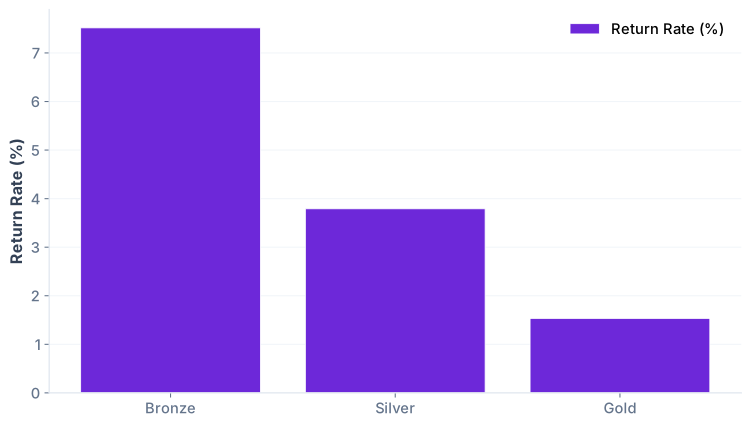
4.2: Vendor Quality — Return Rates by Tier
Analyze whether vendor tier (Gold, Silver, Bronze) correlates with product quality (return rates).
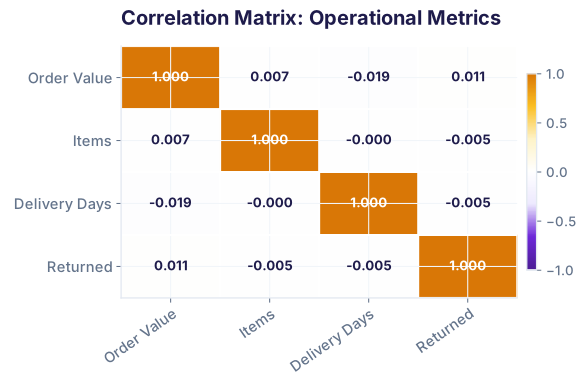
4.3: Operational Correlations
Compute correlations between order value, items per order, delivery time, and returns to spot operational risk patterns.
Step 5: Ship — Executive Deliverable & Recommendation
5.1: KPI Summary
5.2: One-Pager Recommendation
Why this recommendation matters: Beauty is the only high-GMV category (₹41.8M) with double-digit growth. Phones & Accessories is declining (-24.6%) despite being the largest category—a signal to shift inventory. The Bronze vendor issue is a quality crisis (71% of returns on 41% of orders): tightening standards could cut return rate by 1.5pp, saving ₹5.2M in logistics costs. Secondary city expansion targets untapped 36.6% of non-metro demand.
What This Capstone Demonstrates
By completing this analysis, you've practiced:
- Data loading & inspection (Lessons 4–7): Pandas fundamentals, shape/dtypes, null checks.
- Data cleaning (Lessons 8–12): Type coercion, outlier capping, derived features (flags for Cyber Week).
- Exploratory analysis (Lessons 13–17): Groupby aggregations, pivot tables, category/regional breakdowns.
- Advanced analytics (Lessons 18–22): Cohort momentum (WoW growth), correlation matrices, quality metrics (return rate by segment).
- Visualization (Lessons 25–26): Multi-panel dashboard: 7 charts telling the story of growth, concentration, and quality.
- Executive communication (Lessons 27–28): KPI cards, one-pager, recommendation framed for impact and ROI.
Common Pitfalls to Avoid
- Confusing absolute vs. proportional growth: Phones & Accessories is declining (-24.6% WoW) but still the largest category. Don't recommend killing it; instead, understand the shift (post-Cyber Week demand pull-forward).
- Return rate denominator error: Always compute as
returns / total_orders, not returns / returns. Bronze's 7.5% is meaningful only when you know it's based on 3,645 orders. - Cyber Week baseline distortion: If you only compare Cyber Week week to the prior week, you'll miss the larger seasonal context. Always compare to pre-peak baseline.
- Ignoring repeat customers: Secondary cities may have lower per-order volume but higher repeat rates. Cohort analysis by first-order county is essential.
- Not triangulating quality signals: Returns alone don't tell the story. Cross-check with delivery time, vendor tier, and order value to diagnose root causes.
Cheatsheet: Sales Analysis Toolkit
| Task | Code Snippet |
|---|---|
| Load e-commerce data | df = pd.read_csv('sales.csv'); df['date'] = pd.to_datetime(df['date']) |
| GMV by category | df.groupby('category')['order_value'].sum().sort_values(ascending=False) |
| WoW growth rate | (gmv_week2 - gmv_week1) / gmv_week1 * 100 |
| Return rate by segment | df[df['segment']=='X']['is_returned'].mean() |
| Concentration risk | top_2 / total * 100 |
| Correlation heatmap | df[cols].corr(); sns.heatmap(...) |
| Cohort analysis | df.groupby([df['date'].dt.to_period('M'), 'customer_id']).size() |
| KPI card format | Metric name, value (bold, large), unit label (small) |
Ready to Ship Your Analysis?
Join the Best AI Program: The AI-Era Analyst — 5 months, fully online, with placement assistance. Week 1 is free.
Explore The AI-Era Analyst →