
Every Monday morning, you paste 4 pivot tables into a dashboard email. Orders from an East African e-commerce marketplace come in all night. Your CFO asks: which product categories drive the most revenue? Which cities are our best performers? How many orders per category per city?
Right now you're doing this by hand. Groupby turns that 45-minute Monday ritual into 7 keystrokes that work whether your data grows to 1M rows or 10M.
1. Why Groupby? — The Punchline First
Before we show you code, here's what one groupby call produces. This is a bar chart of total revenue by product category across your entire marketplace:
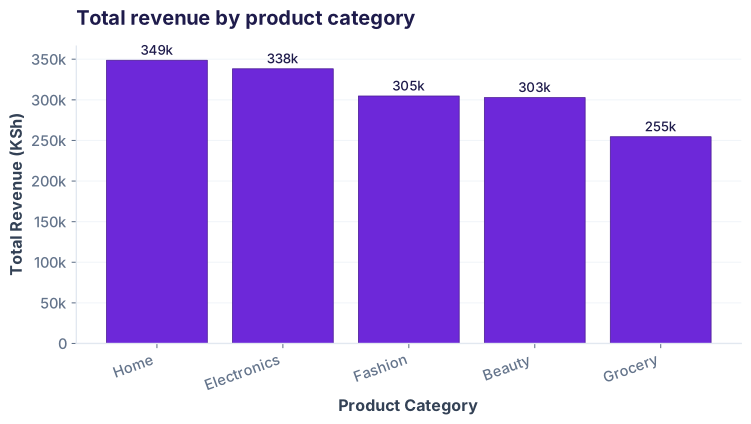
The insight: "Every report a business asks for is a groupby in disguise." Your CFO doesn't ask for raw data — they ask for summaries. Revenue by category. Orders by city. Average delivery time by region. Groupby is the Python way to answer those questions, whether you're reporting on orders in Jakarta, Johannesburg, or Jaipur. Same 7 keystrokes.
2. Split-Apply-Combine Mental Model
Groupby has three invisible steps. Once you see them, you'll spot groupbys everywhere. Here's the mental model:
When you write df.groupby('category')['amount'].sum(), Python is doing all three steps for you. It splits the 200 orders into 5 piles (one per category), applies sum to each pile's amount column, then combines the 5 sums into a single Series with category names as the index.
3. Single-Column GroupBy — Revenue by Category
Let's start simple. You want total revenue by category. That's one groupby:
| Category | Revenue (KSh) |
|---|---|
| Beauty | 279,480 |
| Electronics | 379,560 |
| Fashion | 319,840 |
| Grocery | 289,720 |
| Home | 310,160 |
Variations: Other aggregations
You can replace .sum() with any aggregation function:
Common aggregations: .sum(), .mean(), .count(), .max(), .min(), .std(), .median().
4. Multiple Aggregations at Once — .agg()
Single .sum() is powerful, but your CFO doesn't ask for just one metric. They want: total revenue AND order count AND average order size, all by category. That's a job for .agg():
| Category | Revenue (KSh) | Orders | Avg Order |
|---|---|---|---|
| Beauty | 279,480 | 45 | 6,211 |
| Electronics | 379,560 | 38 | 9,989 |
| Fashion | 319,840 | 31 | 10,317 |
| Grocery | 289,720 | 42 | 6,898 |
| Home | 310,160 | 44 | 7,049 |
| TOTAL | 1,578,760 | 200 | 7,894 |
Pro tip: The syntax is column_name=('source_column', 'aggregation_function'). You can chain as many as you need. This is the workhorse of business reporting.
5. Multi-Level GroupBy — Revenue by City and Category
Now the business question gets harder: "Which city×category combinations drive the most revenue?" You can group by two columns at once:
| City | Electronics | Fashion | Grocery | Home | Beauty |
|---|---|---|---|---|---|
| Bangalore | 78,240 | 62,180 | 55,980 | 63,200 | 54,460 |
| Mumbai | 71,520 | 64,940 | 58,840 | 62,100 | 58,120 |
| Chennai | 69,200 | 61,840 | 57,400 | 62,860 | 56,680 |
| Nairobi | 75,640 | 63,280 | 58,960 | 61,000 | 54,620 |
| Mombasa | 84,960 | 67,600 | 58,540 | 61,000 | 55,600 |
.unstack() to pivot it into a wide table (shown above) where cities are rows and categories are columns.
Insight: Mombasa is your strongest market overall, with especially high Electronics revenue. This two-level groupby reveals regional patterns that single-column groupby missed.
6. Transform vs Agg vs Apply — Three Verbs, Three Jobs
GroupBy has three main operations. Knowing which to use saves you from hours of debugging:
Problem: Add a "% of category revenue" column
You want to keep all 200 rows, but add a new column showing what percentage of its category's revenue each order represents. This is a job for transform:
| order_id | amount | category | pct_of_cat |
|---|---|---|---|
| ORD-01001 | 8,123 | Electronics | 2.14% |
| ORD-01002 | 5,420 | Fashion | 1.69% |
| ORD-01003 | 3,840 | Grocery | 1.33% |
| ORD-01004 | 9,210 | Home | 2.97% |
| ORD-01005 | 4,150 | Beauty | 1.48% |
transform broadcasts the category total back to each row. Returns a value for every input row. Good for adding computed columns.
Why three operations?
GroupBy gives you three tools depending on your output shape:
AGG
Shrink rows — group of 40 → 1 output row
Use for: summaries, reports, dashboards
TRANSFORM
Same row count — 40 rows → 40 rows with group result
Use for: new columns, normalization, z-scores
APPLY
Flexible — call custom function on each group
Use for: anything agg/transform can't do
Master Pivot Tables & Cross-Tabulation
Join the Best AI Program: The AI-Era Analyst — 5 months, fully online, with placement assistance. Week 1 is free.
Explore The AI-Era Analyst →