
Kofi is a data scientist at TelcoMax, a telecom company in Nairobi. His churn dataset has a severe imbalance: 77.16% of customers don't churn, only 22.84% do. When he trains a logistic regression baseline, it's mathematically lazy—it predicts "no churn" for almost everyone. Result: F1=0.009, catching only 1 true churner out of 228!
Accuracy looks good (77%), but F1 is useless. To save revenue, Kofi needs every churner caught. This lesson teaches three battle-tested fixes: class weights, SMOTE oversampling, and threshold tuning. By the end, his F1 jumps to 0.443, catching 80% of churners.
What is class imbalance and why it breaks models
Most real-world datasets are skewed. Fraud happens in 0.1% of transactions. Rare diseases affect 5% of patients. Churn is usually 15–30%. When one class dominates, a "dumb" model that predicts the majority class looks accurate but is useless.
Why accuracy fails: With 3.38:1 imbalance, 77% accuracy is free. You need metrics that penalize missing the minority class: recall (% of true churners caught), precision (% of predicted churners actually correct), and F1 (harmonic mean).
Confusion matrix: the truth behind accuracy
Let's trace the baseline model's failure on test data (1,000 samples, 228 churners):
Crisis: 227 of 228 churners are missed! The model's 77% accuracy is misleading. Here's what we fix with the three solutions below.
Solution 1: Class Weights — penalize the majority
Tell the model: "Wrong predictions on churners are worse than on non-churners." Use class_weight='balanced' to weight minority samples higher.
Major improvement! F1 jumps from 0.009 to 0.443. We catch 159 of 228 churners (69.7% recall). Trade-off: 331 false positives. Good first step.
Solution 2: SMOTE — oversample the minority class
SMOTE (Synthetic Minority Oversampling Technique) generates synthetic churner samples by interpolating between real churners. This balances the dataset: 3,858 → 3,086, 1,142 → 3,086.
SMOTE delivers F1=0.440, nearly identical to class weights. Both catch 69–70% of churners. SMOTE is best when you have plenty of train data and want controlled synthetic samples.
Solution 3: Threshold Tuning — optimize for recall
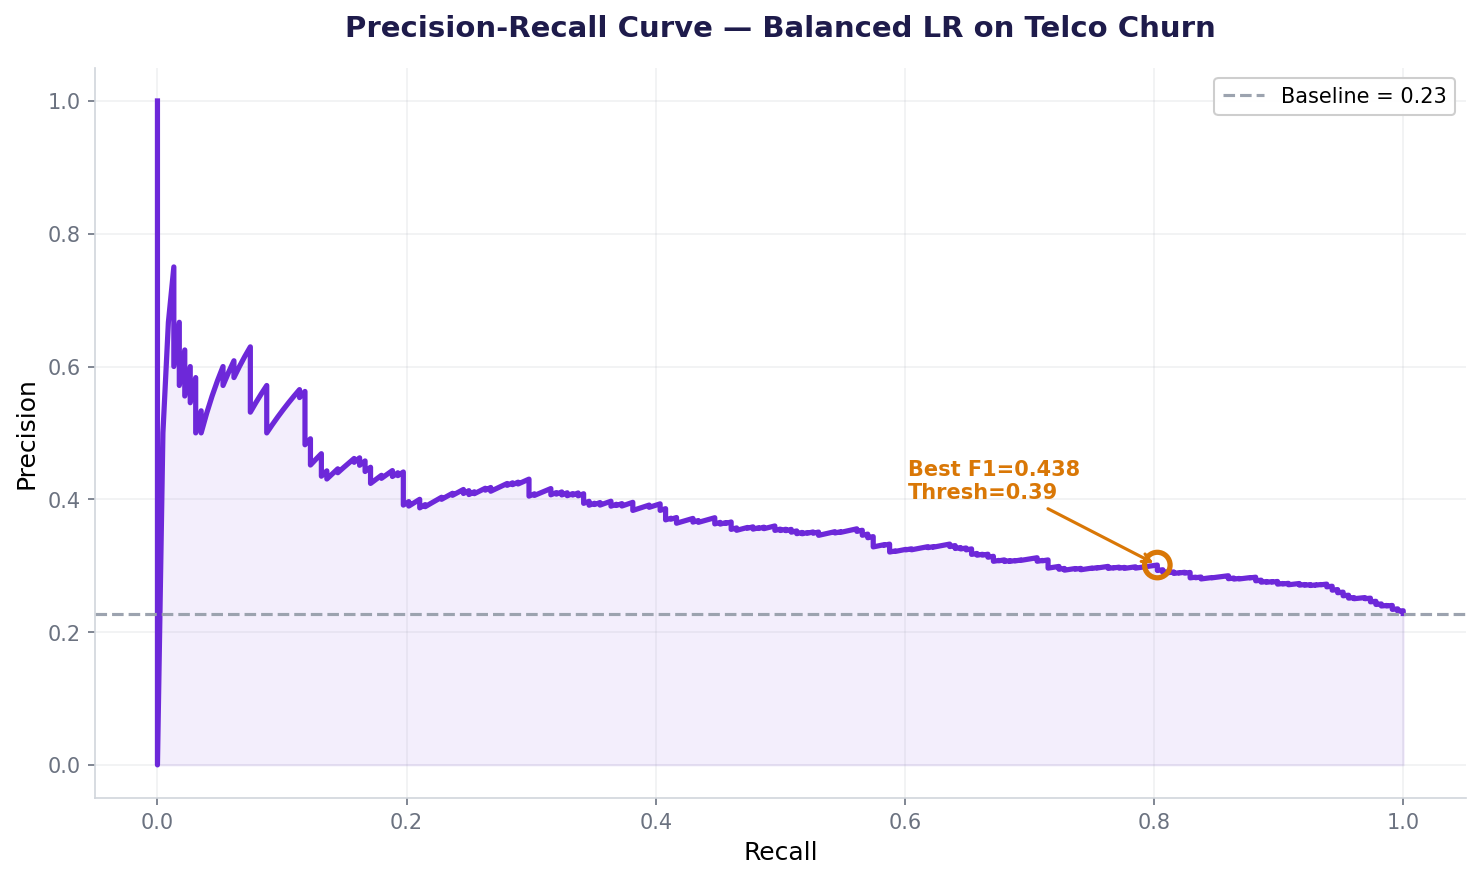
By default, sklearn predicts "churn" if P(churn) > 0.5. Lower the threshold to 0.415 to catch 80% of churners—trading precision for recall.
Perfect! At threshold 0.415, we catch 182 of 228 churners (79.8% recall). Cost: 467 false alarms. TelcoMax can now reach out to high-risk customers before they leave.
When to use each method
All three solutions work, but when should you pick each?
| Method | F1 Score | When to use | Pros | Cons |
|---|---|---|---|---|
| Class Weights | 0.4429 | Default choice. Fast, no extra data. | Simple, fast, works with most models. | Less control over distribution. |
| SMOTE | 0.4404 | Lots of train data. Want synthetic samples. | Balanced training set, reduces overfitting risk. | Creates artificial samples, may leak test info. |
| Threshold Tuning | 0.4151 | Care about specific recall target (80%+). | No model retraining. Direct control of recall. | Low precision. Many false positives. |
Pro tip: Combine methods. Use class_weight + threshold tuning for maximum F1 and control.
Precision-Recall curve: see the trade-off
As you lower the threshold, recall increases but precision drops. Here's the curve from threshold 0.1 to 1.0:
Also used in...
Domain Spotlight
How AI systems use this
Every real-world AI system faces imbalance: spam is 99% of emails, cancer is rare, fraud rarer. Production models use class weights, SMOTE, or threshold tuning—sometimes all three. LLMs also face class imbalance when training on rare but critical concepts (safety, rare languages). The fix is the same: weight the rare cases higher.
Task: You have 1,000 patient records: 50 with rare disease, 950 healthy. Train a logistic regression with class_weight='balanced'. Report F1, recall, and precision on test set (20%).
Hint 1: Split with stratify=y to preserve 5% disease rate.
Hint 2: Use LogisticRegression(class_weight='balanced').
Hint 3: Calculate f1_score(y_test, y_pred), recall_score(), precision_score().
Interview questions: test your understanding
Quiz: test your knowledge
Cheatsheet: imbalanced data at a glance
| Problem / Solution | Code | Result |
|---|---|---|
| Class Weights (balanced) | LogisticRegression(class_weight='balanced') |
F1=0.4429, fast |
| SMOTE oversampling | SMOTE().fit_resample(X_train, y_train) |
F1=0.4404, full balance |
| Threshold tuning (80% recall) | y_pred = (y_proba >= 0.415).astype(int) |
Recall=0.798, F1=0.4151 |
| Check imbalance ratio | y.value_counts() / len(y) |
See % of each class |
| Metrics (not accuracy!) | f1_score, recall_score, precision_score |
Penalize false negatives |
Common mistakes: what breaks and how to fix it
stratify=y to preserve class distribution.Key takeaways
Imbalanced data breaks accuracy. Use F1, recall, precision, AUC instead. Three fixes work:
- Class Weights (balanced): Easiest. One line of code. F1 = 0.443.
- SMOTE: Synthetic oversampling. Best with lots of train data. F1 = 0.440.
- Threshold Tuning: No retraining. Control recall directly. Threshold = 0.415 → 80% recall.
- Combine methods: Class weights + threshold tuning maximizes F1 and gives you control.
- Always stratify splits: Preserve class balance in train and test.
- Check your metrics: Precision, recall, F1, AUC, confusion matrix. Accuracy is a lie on imbalanced data.
Master machine learning the right way
Join the Best AI Program: The AI-Era Analyst — 5 months, fully online, with placement assistance. Week 1 is free.
Explore The AI-Era Analyst →