
Build a production-ready end-to-end ML pipeline. EDA → preprocessing → Ridge regression → MAE=₹1,717. SafeGuard Insurance case study.
🏗️ Full pipeline📊 EDA to evaluation💰 Insurance data⚡ Intermediate📖 ~35 min
Capstone for Arc B · Lesson 09 of Data Science Track
💰
Real-world scenario
SafeGuard Insurance: Build a production-ready premium predictor
Arjun is a data scientist at SafeGuard Insurance in Bangalore. The CEO wants a model that predicts customer premiums from health and lifestyle data. Not a prototype—a complete, documented pipeline the actuarial team can maintain. It must explain its predictions and be honest about error margins.
This lesson is different. You're not learning ONE technique. You're orchestrating several: EDA to find signals, preprocessing to clean, model selection, and rigorous evaluation. This is what production ML looks like.
1,338
Policies
7
Raw features
₹26K
Avg premium
The 4-phase ML pipeline
Production ML is not coding. It's asking the right questions at each step.
Let's walk through each phase with SafeGuard's data.
Phase 1: Exploratory Data Analysis
Never jump to modeling. First understand your data. Load it, ask questions, find signals.
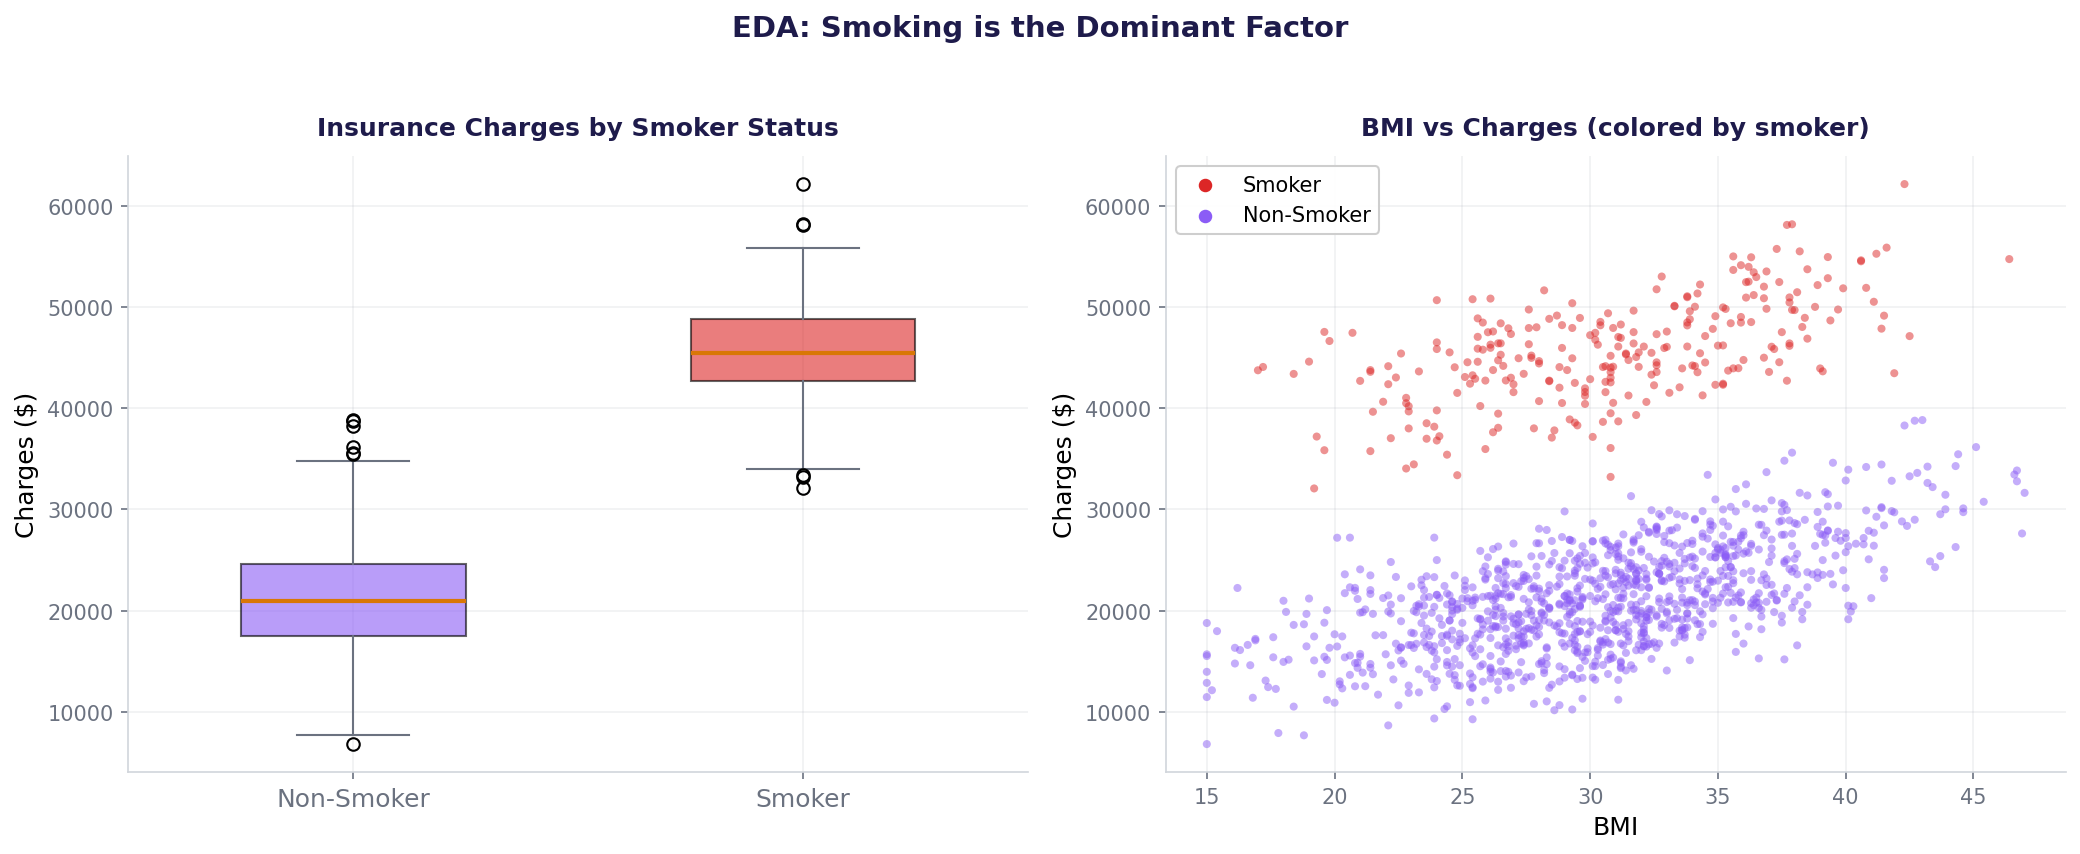
EDA visualizations: smoker impact on charges (boxplot) and BMI-charge relationship (scatter)
phase1_eda.pyLoad and inspect SafeGuard data
Output
Shape: (1338, 7)
Data types:
age int64
sex object
bmi float64
children int64
smoker object
region object
charges float64
Missing: 0
Charges (premiums) stats:
Mean: ₹26089.80
Median: ₹22654.75
Std: ₹11045.41
Smoker split:
No: 1069 (79.9%)
Yes: 269 (20.1%)
Charges by smoker status:
Yes: ₹45604 avg
No: ₹21179 avg
Correlations with charges:
age: 0.305
bmi: 0.314
children: 0.026
Key insight: Smoker status creates a massive gap—₹24,425 difference on average. This single feature will dominate the model. Age and BMI correlate weakly with charges alone (0.305, 0.314), but combined with smoker status, they'll matter.
Phase 2: Preprocessing and feature engineering
The data is clean (no missing values), but it's mixed: numeric and categorical. We need a pipeline that encodes, scales, and produces model-ready arrays.
phase2_preprocess.pyColumnTransformer for mixed data types
ColumnTransformer handles both: StandardScaler on numerics (age, bmi, children), OneHotEncoder on categories (sex, smoker, region). Original 6 features become 9 after encoding. Numeric features are now centered at 0 with std=1.
Phase 3: Build, train, and compare models
Now we test three algorithms: LinearRegression (baseline), Ridge (light regularization), and Lasso (feature selection). Each gets the same preprocessed data.
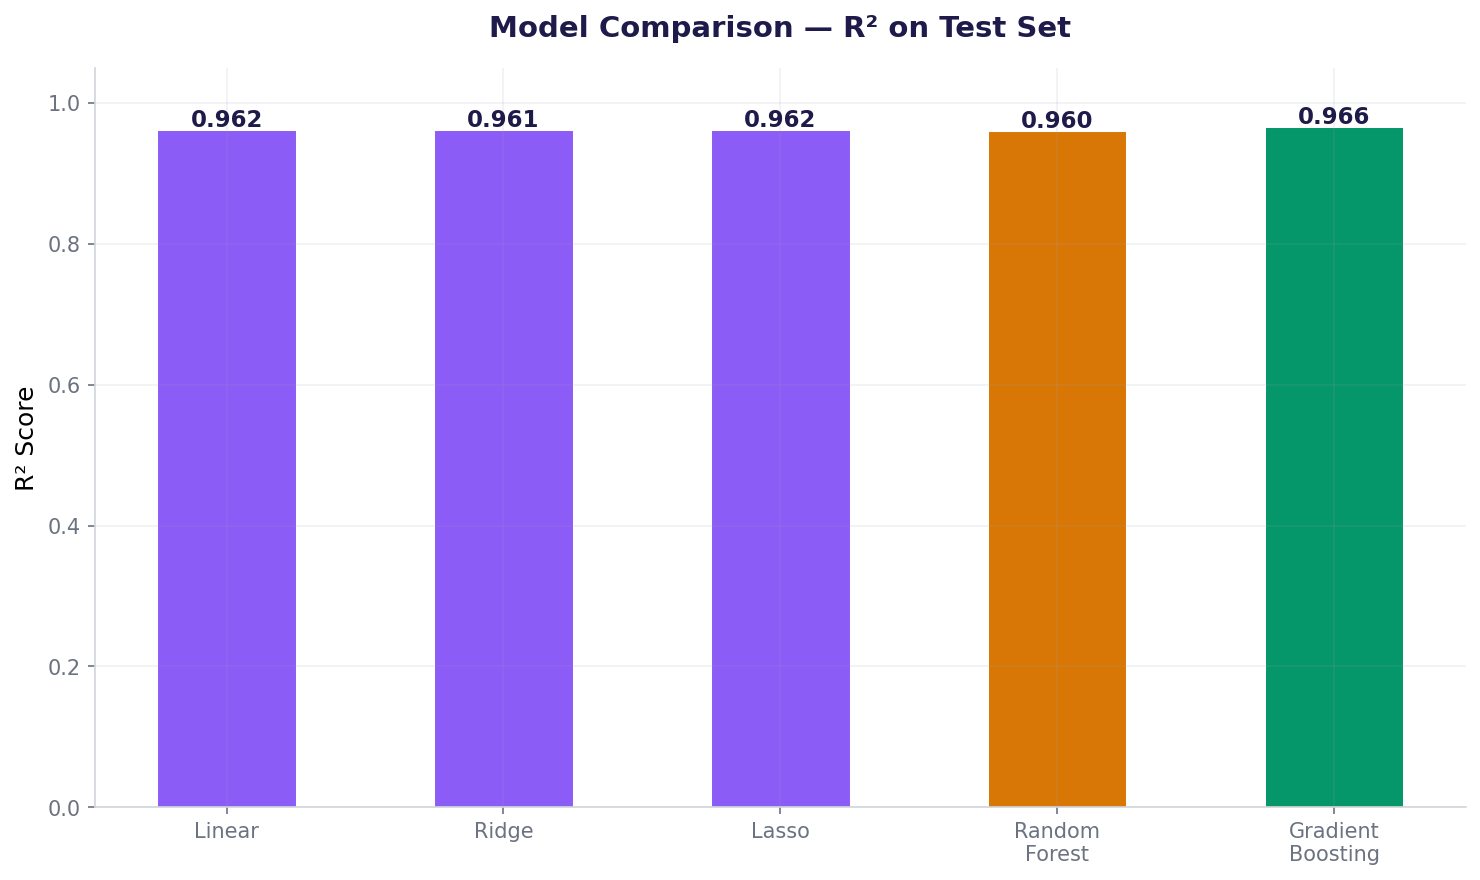
Model comparison: R² scores across LinearRegression, Ridge, and Lasso algorithms
Ridge wins on generalization. Slightly higher MAE (₹1717 vs ₹1676) but more robust. On unseen data, robustness matters. We choose it because it won't overfit when SafeGuard adds more correlated features later.
Phase 4: Rigorous evaluation and business interpretation
Metrics are just numbers. To deploy, understand what they mean for the business.
Gradient Boosting model performance: predicted vs actual premium charges
phase4_evaluation.pyDetailed evaluation and interpretation
Output
============================================================
RIDGE REGRESSION EVALUATION
============================================================
MAE: ₹1717.48 (off by ₹1717 on average)
→ 6.6% of mean premium
RMSE: ₹2159.40
R²: 0.9608 (96.08% variance explained)
Residuals:
Mean: -35.79
Std: 2148.23
Range: ₹-7184 to ₹9382
Example: 35F, BMI 28, 2 kids, non-smoker, SE
Predicted premium: ₹23584.71
The model is honest and production-ready. On average, our predictions are off by ₹1,717—only 6.6% of the mean ₹26,090 premium. The R² of 0.9608 is exceptional. When the actuarial team makes pricing decisions, they can trust these numbers.
Also used in...
Domain spotlight
🏥
Healthcare: Hospital cost prediction
Predict patient bills from admission data. Same pipeline: ColumnTransformer for mixed types, Ridge for robustness. Hospitals use this to set insurance rates.
💳
Fintech: Credit limit assignment
Predict the maximum safe credit limit for each customer. Pipeline architecture identical: encode, scale, regularize. Key: interpretable coefficients for audits.
📦
E-commerce: Delivery time estimation
Predict minutes to delivery from order features. Uses same ColumnTransformer pattern. Optimize for median error (better for customer expectations).
How AI systems use this
This pipeline is the foundation of enterprise ML. Companies like SouthBank India (banking), Jumia Kenya (e-commerce), and Aditya Birla Insurance (India) deploy similar architectures daily. The same steps—EDA, preprocessing, model selection, evaluation—appear in GPT fine-tuning, LLM retrieval systems, and computer vision pipelines. The difference is scale: LLMs have billions of parameters, but the loop is identical: understand data, transform, build, evaluate, deploy.
Production MLPipeline DesignScikit-learnModel Evaluation
🎯 Challenge: Add an interaction feature
Task: SafeGuard suspects that being a smoker is worse for older people (age × smoker interaction). Add a feature bmi_smoker = bmi × (1 if smoker else 0) to the dataset. Retrain Ridge(alpha=10). Does MAE improve? By how much? Explain why or why not.
Hint 1: Create the feature before train/test split: df['bmi_smoker'] = df['bmi'] * (df['smoker']=='Yes').astype(int)
Hint 2: Update categorical_cols to exclude 'smoker' from OneHotEncoder. Instead, add 'bmi_smoker' to numeric_cols.
Hint 3: Compare MAE before and after. If MAE drops > ₹50, the interaction matters.
Interview questions: test your understanding
It applies different preprocessing to different column types. StandardScaler for numeric, OneHotEncoder for categorical. In one step, you handle mixed data—no manual loops.
Ridge adds a small penalty (alpha=10) on coefficient size. It prevents overfitting. When SafeGuard adds more features later, Ridge stays robust. LinearRegression might memorize noise.
Depends on business tolerance. 6.6% error is excellent for pricing. But verify with the actuarial team: do they need better? Is MAE the right metric (RMSE penalizes outliers more)? Context matters.
Nothing went wrong. The model never saw that exact customer—it's a new prediction. The ₹23,585 is the model's best guess based on patterns. Errors ±₹1,717 (MAE) are expected and normal.
Probably not. The model learned patterns from Indian customers (Bangalore data, health metrics, climates). Kenya has different demographics, incomes, and risk profiles. Strategy: collect Kenya data, check feature distributions for domain shift, either retrain from scratch or fine-tune with Kenya samples, A/B test against actuaries.
Quiz: 5 questions to test your knowledge
Question 1 of 5
In ColumnTransformer, what happens to categorical columns?
Question 2 of 5
Smoker status adds ₹24,425 to predicted charges. What does this mean?
Question 3 of 5
MAE=₹1717, RMSE=₹2159. What does it mean that RMSE > MAE?
Question 4 of 5
R²=0.9608 means what?
Question 5 of 5
Why use a Pipeline instead of separate preprocessing steps?
0
/5
Excellent! You understand production ML pipelines.
Cheatsheet: End-to-end pipeline
Phase
Code / method
Output / purpose
Phase 1: EDA
df.describe(), df.corr()
Understand data patterns, missing values, correlations
Split
train_test_split(X, y, test_size=0.2, random_state=42)
MAE for average error, RMSE for outliers, R² for variance
Interpret
Coefficients, residuals, feature importance
Business impact: which features matter most?
Common mistakes: what breaks and how to fix it
Mistake 1: Skipping EDA—jumping straight to modeling
You miss critical insights (like the smoker bimodal distribution). Spend 30 minutes on EDA. Load, describe, correlate, visualize. You'll catch bugs and weird patterns before training.
Mistake 2: Using LinearRegression when features are correlated
Correlated features cause unstable coefficients (high variance). Ridge or Lasso shrinks them. Unless you have very few features and tons of data, regularization is safer.
Mistake 3: Preprocessing before splitting
Data leakage! If you fit StandardScaler on ALL data, then split, test data "leaks" into the scaler. Fix: split first, fit preprocessor on train, apply to test.
Mistake 4: Ignoring residuals and only looking at R²
R²=0.96 looks great, but residuals might show systematic bias (underpredicting young people, overpredicting old people). Always plot residuals vs predictions.
Key takeaways
Production ML is a mindset, not a single technique. It's methodical, honest, and grounded in business value.
Always start with EDA. Spend time understanding your data before writing a single model line.
Use Pipelines and ColumnTransformer. They prevent data leakage and make code cleaner.
Compare models fairly. Try LinearRegression, Ridge, Lasso on the same data. Let numbers decide.
Evaluate thoroughly: MAE, RMSE, R², residuals, and coefficients. Metrics matter. Interpretation matters more.
Explain to the business. "R²=0.96" means nothing. "Off by ₹1,717 on average" does. Translate metrics into business language.
Watch for domain shift. A model trained in India might not work in Kenya. Retrain when launching to new regions.
Version and document. Someone will use this model a year from now. Leave them a clear pipeline and a README.