
Aisha works as a fintech analyst in Nairobi. Every week, she downloads M-Pesa transaction files and needs to spot trends—total volume, top customers, fraud patterns. She's done this in Excel for two years, but the datasets are growing. One notebook can replace a thousand Excel formulas and run in seconds.
This lesson teaches her the fastest way to get there: Jupyter on her laptop, or Google Colab (zero setup, instant access).
This is what data analysis looks like
A notebook is a live script. You write code, it runs instantly, and you see the output below. No compilation, no waiting—just explore.
df.head())—and you see the first 5 rows of your data. Amounts in KSh, transaction IDs, dates, customer IDs, till numbers. This is the starting point for every analysis.
Jupyter vs Colab vs VS Code notebooks
Three ways to write Python analysis. Each has a place. Here's how to pick:
| Tool | Setup | Best for | Downsides |
|---|---|---|---|
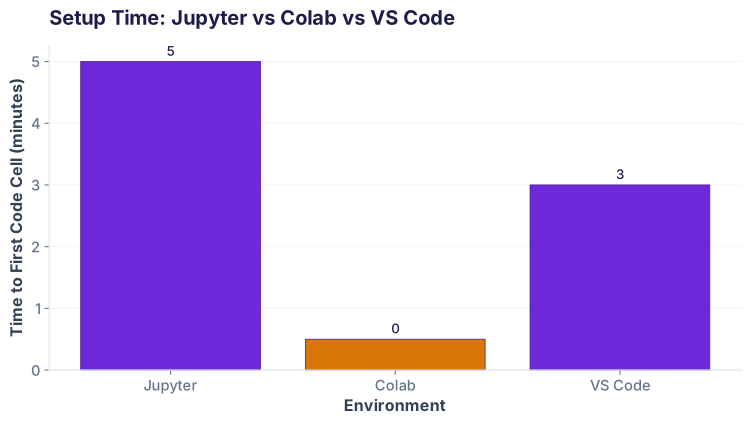
| Jupyter Notebook | 5 mins (pip install) | Local data, full control, offline work | Need Python installed, manual dependency management |
| Google Colab | 30 seconds (open browser) | Quick experiments, team sharing, free GPU | Slower CPU, auto-closes after inactivity, files in Drive |
| VS Code notebooks | 10 mins (install extension) | Heavy development, debugging, version control | More overhead, less community support for notebooks |
Install Jupyter on your laptop (5 minutes)
Open your terminal (Mac: Terminal.app, Windows: Command Prompt or PowerShell, Linux: any shell) and paste these commands.
Step 1: Install pandas, matplotlib, and Jupyter
Step 2: Start Jupyter
This command opens Jupyter in your browser at http://localhost:8888. The first time, Jupyter prints a token—paste it into the browser if it doesn't auto-login.
Step 3: Verify pandas is installed
Click "New → Python 3" to create a notebook, then paste this code into a cell and press Shift+Enter:
pip install pandas again.
Or use Google Colab (zero setup)
No laptop setup needed. If you have a Google account, you have Colab. Go to colab.research.google.com, click "New notebook", and you're live in 10 seconds.
- Free GPU. Heavy data? Colab offers free GPU acceleration for intensive operations.
- Auto-save to Google Drive. No worrying about lost work—Colab syncs to Drive automatically.
- Shareable like Google Docs. Invite teammates to collaborate in real-time on the same notebook.
- Pre-installed pandas. Import pandas, numpy, matplotlib, sklearn—all ready to go. No pip install needed.
Setup time comparison:
Your first notebook: load and explore M-Pesa data
Let's walk through a real analyst workflow. We'll load a tiny M-Pesa dataset (100 transactions), explore it, and extract insights—all in 4 cells.
Cell 1: Import pandas
Every notebook starts here. This loads the pandas library.
Cell 2: Load the CSV
The CSV file lives on your disk (or in Colab's Drive). pd.read_csv() converts it into a DataFrame—a table you can manipulate.
Cell 3: View the data
The magic cell. df.head() shows the first 5 rows. This is how you sanity-check: "Do the dates look right? Are the amounts in KSh? Are there nulls?"
| txn_id | date | amount | customer_id | till_number |
|---|---|---|---|---|
| M001 | 2026-02-01 | 15000 | C_KE_0042 | SAFM_NAIROBI_01 |
| M002 | 2026-02-01 | 8500 | C_KE_0156 | SAFM_WESTLANDS |
| M003 | 2026-02-01 | 42000 | C_KE_0089 | SAFM_KAREN |
| M004 | 2026-02-01 | 5200 | C_KE_0042 | SAFM_NAIROBI_01 |
| M005 | 2026-02-02 | 127000 | C_KE_0295 | SAFM_KAREN |
Cell 4: Answer a question
Now compute. What's the total transaction volume for February?
Keyboard shortcuts that save hours
Notebooks reward speed. Learn these and you'll fly through analysis:
| Shortcut | Action | Why it matters |
|---|---|---|
| Shift + Enter | Run cell | Your most-used shortcut. Run code and move to next cell. |
| Ctrl + Enter | Run cell (stay) | Run code but stay in the same cell. Good for tweaking parameters. |
| Esc + A | Insert cell above | Add a new cell above the current one. |
| Esc + B | Insert cell below | Add a new cell below the current one. Most common. |
| Esc + DD | Delete cell | Remove a cell (press Esc, then D twice fast). |
| Esc + M | Convert to Markdown | Turn a code cell into a text cell (for notes). |
| Esc + Y | Convert to Code | Turn a Markdown cell back into code. |
| Tab | Autocomplete | Type df.gr, press Tab, Jupyter suggests groupby. Saves typing. |
H in a notebook to see all keyboard shortcuts. (Or Esc + H in Jupyter.)
Where you see this
Industries & use cases
How this connects to AI
Notebooks are where data scientists build ML models. You load data with pandas (this lesson), explore it (next lesson), clean it (arc 3), then feed it into TensorFlow or scikit-learn to build fraud detectors, churn predictors, and recommendation engines. Colab is popular for ML because it offers free GPU—perfect for training models on large datasets.
Mini Challenge
Task: Open Google Colab (colab.research.google.com), create a new notebook, and create 3 cells:
- Import pandas
- Load a sample CSV (you can create one or use a public dataset)
- Run
df.head()to display the first 5 rows
Once you see a table printed, you've completed the challenge. Bonus: try df.describe() in a 4th cell to see descriptive statistics.
!pip install pandas if needed (Colab usually has it pre-installed). For a test dataset, try df = pd.read_csv('https://raw.githubusercontent.com/mwaskom/seaborn-data/master/iris.csv').
Interview questions
pip install package_name in a code cell (prefix with ! in Jupyter). Or create a requirements.txt file and run pip install -r requirements.txt in your terminal. For reproducibility, always pin versions: pip install pandas==1.5.3 ensures everyone runs the same code.
Test your knowledge
df.head() do?Cheatsheet
| Task | Code | Result |
|---|---|---|
| Load CSV into DataFrame | df = pd.read_csv('data.csv') |
DataFrame from file |
| View first 5 rows | df.head() |
First 5 rows displayed |
| View last 3 rows | df.tail(3) |
Last 3 rows |
| DataFrame shape | df.shape |
(rows, columns) |
| Column names | df.columns |
List of column names |
| Data types | df.info() |
Columns, types, nulls |
| Summary statistics | df.describe() |
Mean, std, min, max per column |
| Sum a column | df['amount'].sum() |
Total of that column |
| Count rows | len(df) |
Number of rows |
| Save to CSV | df.to_csv('out.csv', index=False) |
Exports DataFrame to file |
Common pitfalls
jupyter notebook again in a fresh terminal.pd.read_csv('/Users/aisha/data/mpesa.csv'). In Colab, upload files to Drive and use from google.colab import drive; drive.mount('/content/drive').pip install pandas in your terminal (outside the notebook). If you're in Colab, run !pip install pandas in a cell. If Jupyter is using a different Python version, check with which python and which pip.Key takeaways
Jupyter notebooks: Interactive, cell-based Python environment. Perfect for data exploration and analysis. Install locally, run offline, full control.
Google Colab: Browser-based notebook with zero setup, free GPU, and auto-save to Drive. Best for learning and quick experiments.
Keyboard shortcuts: Shift+Enter (run cell), Esc+B (new cell below), Esc+DD (delete cell). Mastering these saves hours.
Workflow: Load CSV → explore with df.head() → check with df.describe() → ask questions and compute answers.
Next steps: Every analyst you know uses notebooks. Once you're comfortable here, you'll move to cleaning data (nulls, duplicates), then exploring (groupby, pivot), then visualizing (charts).
Ready to move beyond spreadsheets?
Join the Best AI Program: The AI-Era Analyst — 5 months, fully online, with placement assistance. Week 1 is free.
Explore The AI-Era Analyst →