
Esther works for a healthcare NGO in Nakuru, Kenya. She's analyzing clinic visit data across 12 Rift Valley clinics to report to donors about ante-natal care coverage. Every column in her data has a type that dictates what she can do with it—that's today's lesson.
The visual hero: understanding data types
Every DataFrame column has a type. Understanding these types is everything—your type determines what you can filter, aggregate, and analyze.
| visit_id object | date datetime64 | clinic object | patient_age int64 | anc_visit int64 | bp_systolic int64 | bp_diastolic int64 | status object |
|---|---|---|---|---|---|---|---|
| ANC001 | 2026-01-04 | Nakuru Level 5 | 28 | 1 | 120 | 80 | normal |
| ANC002 | 2026-01-04 | Molo Sub-County | 31 | 2 | 128 | 85 | high_bp |
| ANC003 | 2026-01-05 | Njoro Health Centre | 25 | 1 | 115 | 75 | normal |
| ANC004 | 2026-01-05 | Bahati Health Centre | 34 | 3 | 132 | 88 | high_bp |
| ANC005 | 2026-01-06 | Elementaita Dispensary | 22 | 1 | 118 | 78 | normal |
| ANC006 | 2026-01-06 | Naivasha Level 4 | 29 | 2 | 125 | 82 | normal |
| ANC007 | 2026-01-07 | Nakuru Level 5 | 26 | 1 | 110 | 72 | normal |
| ANC008 | 2026-01-07 | Molo Sub-County | 35 | 4 | 138 | 92 | referred |
object columns (visit_id, clinic, status) are text and categorical—you can filter and count them. The int64 columns (age, blood pressure) are numbers—you can average, sum, and compare them. The datetime64 column (date) unlocks time-based filtering and grouping.
Series vs DataFrame: 1D vs 2D thinking
Pandas has two core data structures. A Series is a single column of labeled values (1D). A DataFrame is many columns stacked together (2D)—it's a spreadsheet.
Series: one column at a time
—————————
120
128
115
132
122
DataFrame: the full table
| clinic | patient_age | bp_systolic |
|---|---|---|
| Nakuru L5 | 28 | 120 |
| Molo | 31 | 128 |
| Njoro | 25 | 115 |
The 10 methods that carry 80% of the work
These 10 methods appear in 90% of real Pandas analysis. Master these and you've cracked data exploration.
| Method | What it does | When to reach for it |
|---|---|---|
.head() |
Shows first N rows (default 5) | First thing: preview your data. Is it loaded right? Any parsing issues? |
.tail() |
Shows last N rows | Check the end of your dataset. Did imports finish? Any incomplete rows? |
.info() |
Column names, types, non-null counts | Audit your data structure. How many missing values per column? Wrong dtypes? |
.describe() |
Mean, std, min, max, quartiles (numeric cols) | Quick statistics. Is the range sensible? Outliers lurking? |
.shape |
Tuple (rows, columns) | How big is my dataset? (42 rows, 8 columns) |
.columns |
List of all column names | Remind yourself of available fields. Any typos in column names? |
.dtypes |
Data type per column | Sanity check. Is 'date' a datetime or string? Is 'amount' int or float? |
.value_counts() |
Unique value counts (on a Series) | How many visits per clinic? Which status appears most? |
.isnull().sum() |
Missing value count per column | Data quality check. Which columns have gaps? |
.sample() |
Random N rows | Quick sanity check on a big dataset. Spot weird patterns without reading all data. |
Inspecting Esther's clinic data: picture first, code second
Let's apply these 10 methods to Esther's real clinic data. Each visual comes first—that's the lesson. Then we show the code that produced it.
pd.read_csv('clinic_visits.csv') works.Step 1: .head() — preview the first 5 rows
| visit_id | date | clinic | patient_age | anc_visit_number | bp_systolic | bp_diastolic | status |
|---|---|---|---|---|---|---|---|
| ANC001 | 2026-01-04 | Nakuru Level 5 | 28 | 1 | 120 | 80 | normal |
| ANC002 | 2026-01-04 | Molo Sub-County | 31 | 2 | 128 | 85 | high_bp |
| ANC003 | 2026-01-05 | Njoro Health Centre | 25 | 1 | 115 | 75 | normal |
| ANC004 | 2026-01-05 | Bahati Health Centre | 34 | 3 | 132 | 88 | high_bp |
| ANC005 | 2026-01-06 | Elementaita Dispensary | 22 | 1 | 118 | 78 | normal |
Step 2: .info() — audit structure and missing data
RangeIndex: 42 entries, 0 to 41
Data columns (total 8 columns):
# Column Non-Null Count Dtype
--- ------ -------------- -----
0 visit_id 42 non-null object
1 date 42 non-null object
2 clinic 42 non-null object
3 patient_age 42 non-null int64
4 anc_visit_number 42 non-null int64
5 bp_systolic 42 non-null int64
6 bp_diastolic 42 non-null int64
7 status 42 non-null object
dtypes: int64(4), object(4)
memory usage: 3.0 KB
date is object (string), not datetime64—Esther will need to parse it with pd.to_datetime() to unlock date operations.
Step 3: .describe() — numeric summary statistics
| patient_age | anc_visit_number | bp_systolic | bp_diastolic | |
|---|---|---|---|---|
| count | 42.0 | 42.0 | 42.0 | 42.0 |
| mean | 28.3 | 1.9 | 123.1 | 81.8 |
| std | 4.2 | 1.1 | 8.5 | 6.1 |
| min | 22.0 | 1.0 | 110.0 | 72.0 |
| 25% | 25.0 | 1.0 | 118.0 | 78.0 |
| 50% | 28.5 | 2.0 | 123.0 | 82.0 |
| 75% | 31.0 | 2.0 | 130.0 | 86.0 |
| max | 36.0 | 4.0 | 142.0 | 95.0 |
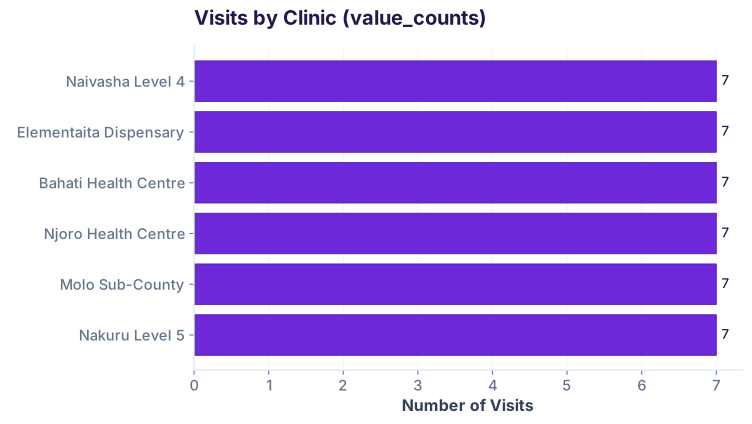
Step 4: .value_counts() — clinic visit distribution
Selecting data: .loc vs .iloc
Pandas has two ways to select rows and columns. .loc uses labels (column names, row index). .iloc uses integer positions (0, 1, 2...).
| Method | Selects by | Example |
|---|---|---|
| .loc | Label (column name, condition) | df.loc[df['age'] > 25] — rows where age > 25 |
| .iloc | Integer position (0, 1, 2...) | df.iloc[0:5] — rows 0 through 4 by position |
| .loc with columns | Combine row + column selection | df.loc[df['status']=='normal', ['clinic','age']] |
| .iloc mixed | Position-based rows + columns | df.iloc[0:10, [0,2,5]] — first 10 rows, columns 0, 2, 5 |
Real example: filter by condition and select columns
| patient_age | clinic |
|---|---|
| 28 | Nakuru Level 5 |
| 25 | Njoro Health Centre |
| 22 | Elementaita Dispensary |
| 26 | Nakuru Level 5 |
| 24 | Njoro Health Centre |
Quick filter patterns: the 5 you'll use daily
These five patterns cover 95% of real filtering. Bookmark this section.
| Pattern | Code | Result |
|---|---|---|
| Filter by single value | df[df['status'] == 'normal'] |
Rows where status is exactly 'normal' |
| Filter by range | df[(df['patient_age'] >= 25) & (df['patient_age'] <= 35)] |
Ages 25–35 inclusive |
| Filter by list | df[df['status'].isin(['normal', 'high_bp'])] |
Either normal or high_bp status |
| Filter by string contains | df[df['clinic'].str.contains('Nakuru')] |
Clinics with 'Nakuru' in the name |
| Filter by null | df[df['bp_systolic'].isnull()] |
Rows with missing BP |
Where you see this in the real world
Industries & use cases
How this connects to AI & ML
Every ML pipeline starts here. You load data with pd.read_csv(), inspect with .head() and .info(), filter and clean it with .loc/.iloc, then feed it to scikit-learn or TensorFlow. Before you can train a model to predict high-risk pregnancies, you need to understand your data—that's what these methods do.
Mini Challenge
Task: Load clinic_visits.csv. Group by clinic and calculate median BP systolic per clinic. Which clinic has the highest median BP? Also count how many visits each clinic had. Hint: use .groupby('clinic')[['bp_systolic', ...]].agg().
df.groupby('clinic')['bp_systolic'].median().sort_values(ascending=False) will show you medians by clinic sorted high to low.
Interview questions
.head() only shows first 5 rows; it hides problems later in the file. .info() shows: (1) total row count, (2) data types per column, (3) missing values. It catches dtype mismatches (date stored as string) and nulls that .head() wouldn't reveal.
.isnull() returns True/False for each cell; .sum() counts the Trues. It's a data quality check—you want to know which columns have gaps before analyzing.
and is a Python operator that works on single booleans, not arrays. Pandas uses & (bitwise AND) for element-wise comparison. Also, parentheses are required around each condition because & has higher precedence than comparison operators.
Test your knowledge
df.shape return?df['clinic'].value_counts() return?.loc and .iloc?& instead of and in df[(df['col'] > 5) & (df['col2'] < 10)]?Cheatsheet: quick reference
| Task | Code | Returns |
|---|---|---|
| Load CSV | df = pd.read_csv('data.csv') |
DataFrame from file |
| First N rows | df.head(5) |
First 5 rows |
| Last N rows | df.tail(3) |
Last 3 rows |
| Row & column count | df.shape |
Tuple (rows, cols) |
| Column names | df.columns |
Index of column names |
| Data types | df.dtypes |
Type per column |
| Full audit | df.info() |
Types, nulls, memory |
| Numeric stats | df.describe() |
Count, mean, std, min, max, quartiles |
| Unique value counts | df['col'].value_counts() |
Series of counts |
| Missing values | df.isnull().sum() |
Null count per column |
| Random sample | df.sample(5) |
5 random rows |
| Filter by condition | df[df['age'] > 25] |
Rows where age > 25 |
| Filter & select columns | df.loc[cond, ['col1','col2']] |
Filtered rows, 2 columns |
| Select by position | df.iloc[0:10, 0:5] |
First 10 rows, first 5 columns |
Common pitfalls
df.head vs df.head()df.head returns the method object (not data). Always add parentheses: df.head(). Same for .info(), .describe(), etc.
and instead of & in multi-condition filtersdf[df['age'] > 25 and df['status'] == 'normal']RIGHT:
df[(df['age'] > 25) & (df['status'] == 'normal')]Parentheses required around each condition.
.describe() with .info().describe() = numeric stats (mean, std, min, max). .info() = column types, non-null counts, memory. Use .describe() to understand data ranges; use .info() to audit structure.
df.info() shows date: object (string) when you expected dates, convert: df['date'] = pd.to_datetime(df['date']). Then you can filter by date ranges.
.head() means your data is clean.info(), .describe(), .isnull().sum() to audit the full dataset. First 5 rows can hide problems in rows 50–500.
Ready to go deeper?
Join the Best AI Program: The AI-Era Analyst — 5 months, fully online, with placement assistance. Week 1 is free.
Explore The AI-Era Analyst →