Master unsupervised clustering with K-Means. Learn the algorithm, elbow method, silhouette score, and segment customers into 5 natural groups. Real TelcoMax mall customer data.
🔀 Unsupervised Learning📊 Clustering Algorithm🏬 Customer Segmentation⚡ Intermediate📖 ~22 min
Lesson 20 of Data Science Track
🏬
Real-world scenario
TelcoMax (Nairobi): 200 mall customers, no labels, segment for targeted campaigns
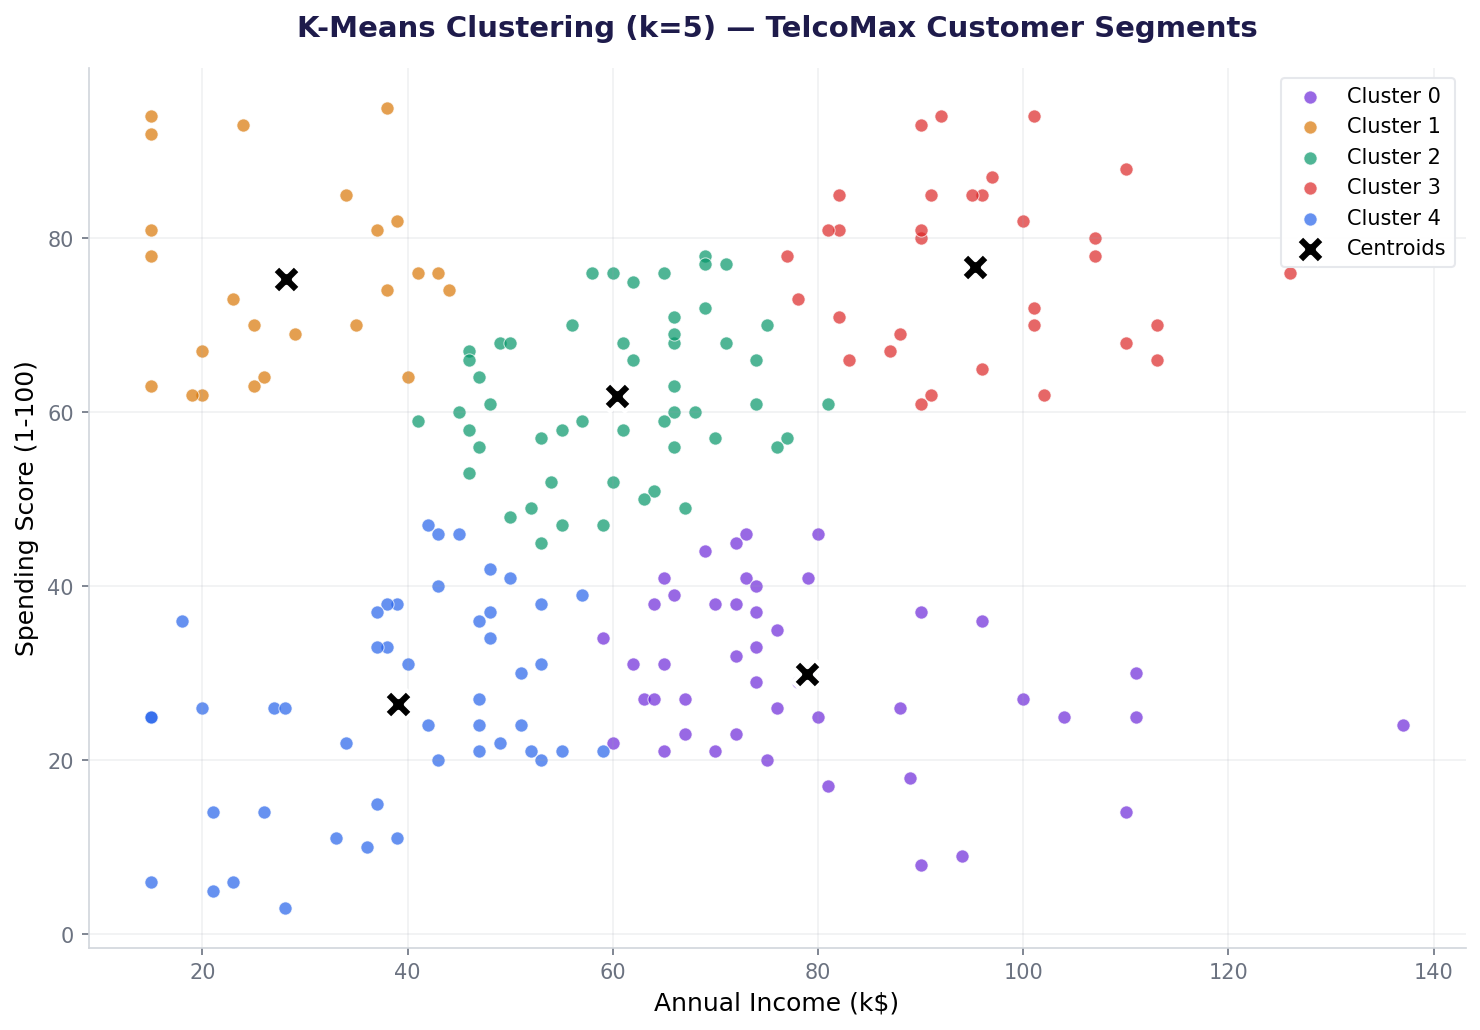
TelcoMax's marketing team in Nairobi has a dataset of 200 mall customers with two key metrics: annual income (K) and spending score (1–100). They want to group similar customers together for targeted promotions, but they don't have predefined categories. This is pure unsupervised learning—no labels, no ground truth.
K-Means is the perfect tool. It will find natural clusters in the data, revealing which customers are "high-income savers," "budget enthusiasts," or "premium spenders." Then they can tailor campaigns to each group.
200
Customers
2
Features (income, spending)
5
Optimal clusters
What is unsupervised learning?
In supervised learning (linear regression, classification), you have labels and train to predict them. In unsupervised learning, you have only features—no target variable. The goal is to discover hidden patterns.
Clustering: Group similar data points together (K-Means, hierarchical) Dimensionality reduction: Compress high-dimensional data (PCA) Anomaly detection: Spot outliers and unusual points (isolation forests) Association rules: Find relationships (market basket analysis)
K-Means is the gold standard for clustering. It's fast, interpretable, and works on any numeric data.
The K-Means algorithm: step-by-step
K-Means finds k cluster centers (centroids) and assigns each point to its nearest centroid. It repeats until convergence.
Step 1: Choose k — decide how many clusters you want Step 2: Randomly initialize k centroids — pick k random points as centers Step 3: Assign points to nearest centroid — each point joins the closest cluster Step 4: Update centroids — compute the mean of each cluster Step 5: Repeat steps 3–4 — until centroids stop moving (convergence)
The algorithm minimizes inertia, the sum of squared distances from each point to its centroid. Lower inertia = tighter clusters.
Load and explore TelcoMax mall customer data
load_data.pyLoad 200 customers, inspect features
Output
Shape: (200, 4)
First 5 rows:
gender age income_k spending_score
0 Female 19 15.0 39
1 Male 21 15.0 81
2 Female 20 16.5 6
3 Female 23 16.5 77
4 Female 31 17.0 40
Basic stats:
income_k spending_score
count 200.00 200.00
mean 60.50 50.50
std 26.67 25.17
min 15.00 1.00
max 137.00 99.00
Scale features before clustering
K-Means is distance-based. If income (0–137) and spending (1–99) are on different scales, income will dominate. Use StandardScaler to normalize both to mean=0, std=1.
Cluster products by price, category, sales volume. Group similar items for merchandising and cross-sell strategies.
🧬
Genomics: Gene sequence clustering
Group DNA sequences by similarity. Cluster genes with similar function, identify disease markers.
🖼️
Image compression: Pixel clustering
K-Means clusters pixel colors into k representative colors. Reduces file size while preserving visual quality.
How AI systems use this
K-Means is the foundation of many AI systems. Recommendation engines cluster users and products. Computer vision systems cluster pixels to compress images. LLMs use clustering for data preprocessing. Every unsupervised learning task starts with understanding how data naturally groups together.
Task: Load a CSV with bank customer data (age, balance, transactions). Scale the numeric features. Use the elbow method to find optimal k. Fit K-Means and print cluster profiles (mean age, balance, transaction count per cluster).
Hint 1: Scale with StandardScaler().fit_transform(X)
Hint 2: Loop k from 2 to 8, compute KMeans(k).fit(X_scaled).inertia_
Hint 3: Plot inertia vs k or inspect printed values for the elbow
Hint 4: Group by cluster: df.groupby('cluster')[['age', 'balance', 'transactions']].mean()
Interview questions: test your understanding
Unsupervised learning finds patterns in data without labels. K-Means groups similar points together. No target variable, just features. Goal: discover hidden structure.
1) Choose k. 2) Randomly init k centroids. 3) Assign each point to nearest centroid. 4) Update centroids as cluster means. 5) Repeat 3–4 until centroids stop moving.
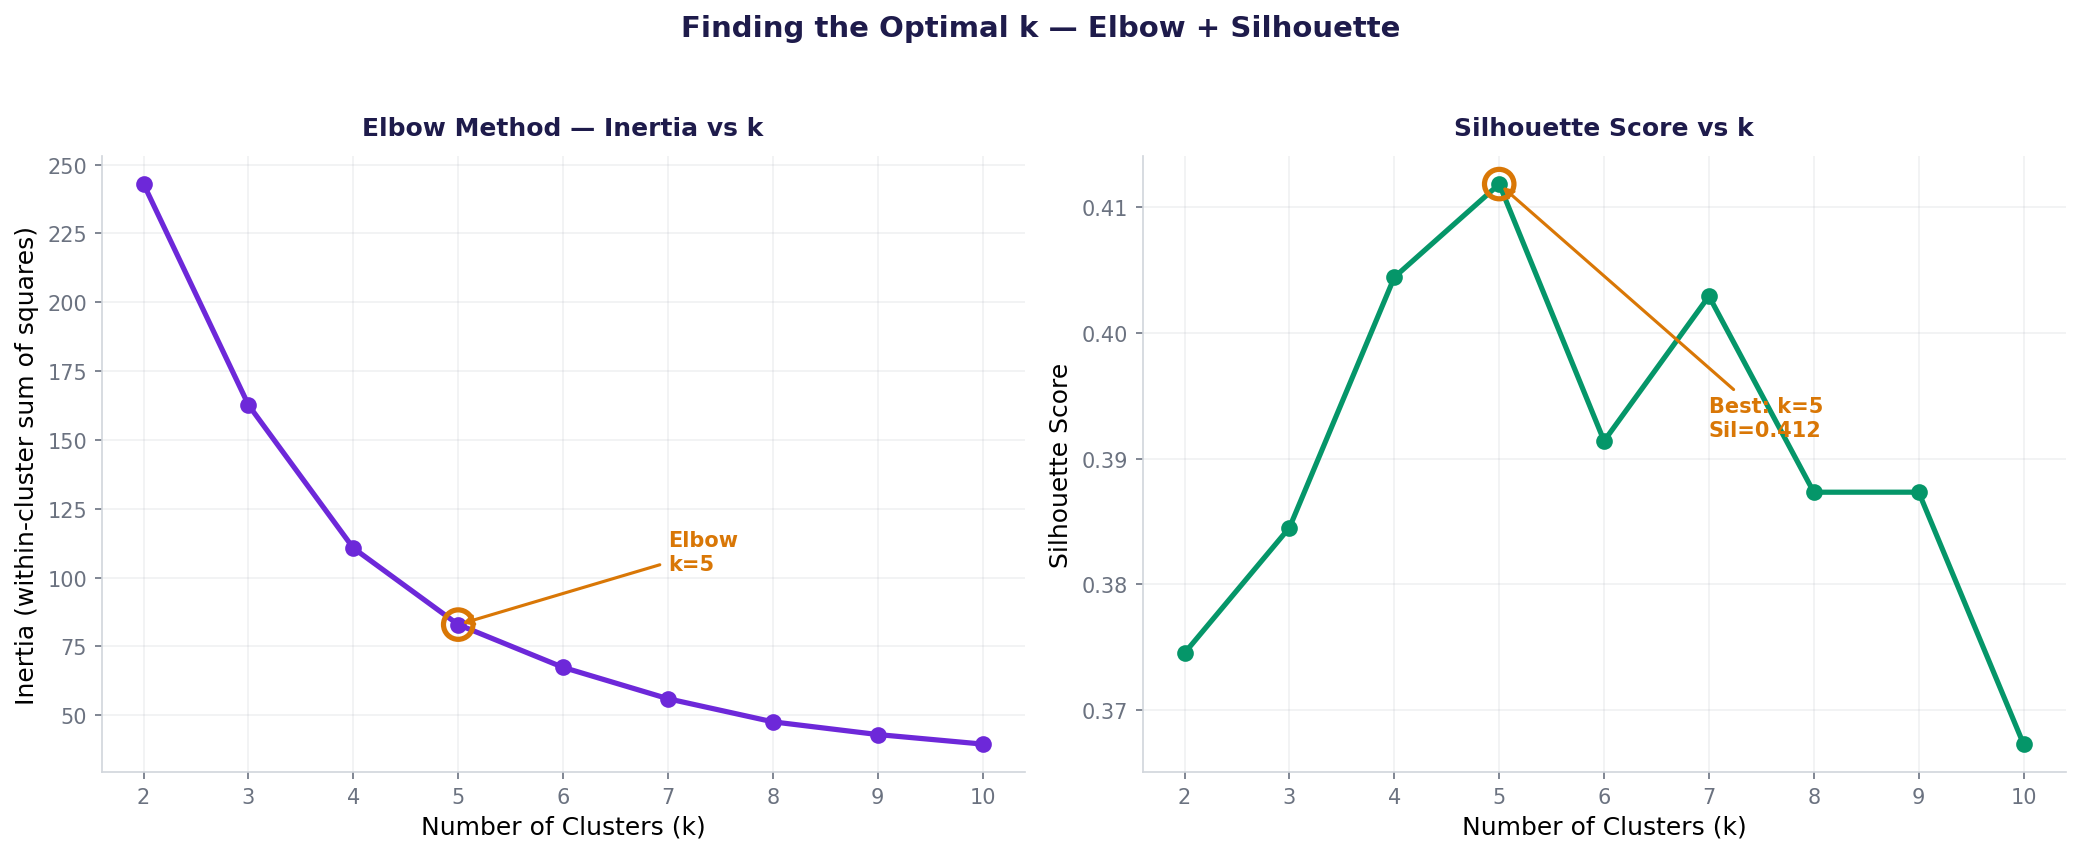
Use two methods: (1) Elbow method—plot inertia vs k, look for where the curve flattens. (2) Silhouette score—higher is better (range -1 to 1). Both should agree on optimal k.
K-Means is distance-based (Euclidean). If income ranges 0–137 and spending 1–99, income will dominate distance calculations. StandardScaler normalizes both to mean=0, std=1, so all features contribute equally.
Use n_init parameter (default 10 in newer sklearn). Fit the model n_init times with different random initializations, keep the best (lowest inertia). For critical applications, try multiple k values and validate with domain knowledge.
Quiz: 5 questions to test your knowledge
Question 1 of 5
What is the main goal of K-Means clustering?
Question 2 of 5
What does the elbow method help you find?
Question 3 of 5
Which silhouette score range is best?
Question 4 of 5
Why is feature scaling important for K-Means?
Question 5 of 5
K-Means finds a local optimum. How do you reduce the risk?
0
/5
Excellent! You understand K-Means clustering.
Cheatsheet: K-Means at a glance
Step
Code
Purpose
Load data
pd.read_csv('file.csv')
Read CSV into DataFrame
Scale
StandardScaler().fit_transform(X)
Normalize to mean=0, std=1
Elbow loop
KMeans(k).fit(X).inertia_
Compute inertia for each k
Silhouette
silhouette_score(X, labels)
Quality metric (-1 to 1)
Fit model
KMeans(n_clusters=5, n_init=10).fit(X)
Train clustering model
Assign labels
kmeans.predict(X) or fit_predict(X)
Get cluster labels
Cluster centers
kmeans.cluster_centers_
Centroid coordinates
Common mistakes: what breaks and how to fix it
Mistake 1: Not scaling features
K-Means uses Euclidean distance; unscaled income (0–137) will dominate scaled spending (1–99). Fix: always use StandardScaler().fit_transform(X) before clustering.
Mistake 2: Ignoring local optima
K-Means may converge to a poor local minimum. You get a different clustering each run. Fix: use n_init=10 (or higher) to run multiple times, keep the best.
Mistake 3: Choosing k arbitrarily
Picking k without analysis leads to meaningless clusters. Fix: use elbow method (plot inertia vs k) and silhouette score to validate choice.
Mistake 4: Interpreting clusters without domain knowledge
K-Means finds statistical clusters, not always meaningful business segments. Fix: always validate results with domain experts. Are the clusters actionable?
Key takeaways
K-Means is the workhorse of unsupervised learning. Master it, and you unlock pattern discovery in any dataset.
K-Means partitions data into k groups by minimizing inertia (distance to centroid).
Always scale features first. Euclidean distance is sensitive to feature magnitude.
Use elbow method and silhouette score to find optimal k. Both metrics should agree.
Handle local optima: Set n_init=10 to run multiple random initializations, keep the best.
Interpret clusters with domain knowledge. Statistical groups ≠ business segments.
K-Means is fast, scalable, and interpretable. It's the first clustering algorithm to try.