Build an end-to-end analysis: load 8,000 subscriber records, identify churners, and deliver a one-page executive recommendation. This capstone ties together all 28 lessons.
💻 10 code blocks📊 8 charts🎯 Real telecom data⏱ 60–90 min
Prev: Notebook to Report
Next: Mentorship Cohort
📱
Scenario
Head of Retention, Safaricom Consumer
You work in the retention team at Safaricom, East Africa's largest mobile operator. It's mid-Q1, and the head of consumer products suspects churn is creeping up among prepaid subscribers. Leadership needs your answer by Thursday EOD:
Which segments are churning fastest?
What's driving the churn?
How much revenue is at risk?
What's your recommended intervention, and what's the ROI?
Your deliverable: A one-page executive brief with KPIs, a key chart, and a recommendation backed by the data.
8,012
Subscriber Records
21.9%
Overall Churn Rate
Q1 2024
Data Period
What You'll Build
Your Capstone Deliverable
Data quality audit: Load, inspect shape/types, identify missing data (1 chart).
Exploratory Deep Dive: Churn by plan, tenure curve (month-3 cliff), usage patterns (3 charts).
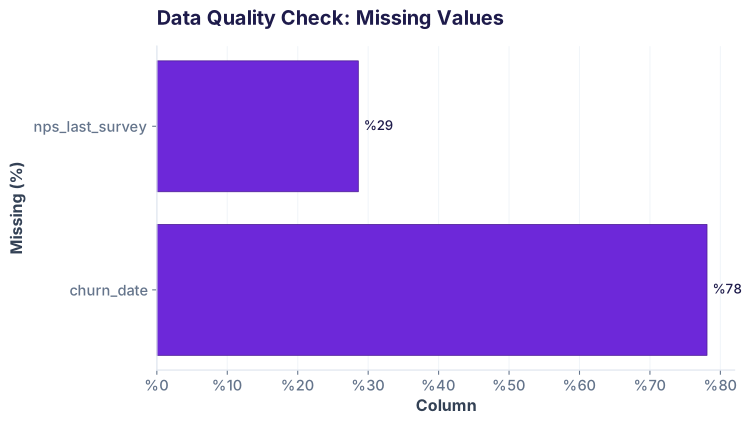
Key observations: Your dataset has 8,012 rows, 13 columns, mostly complete except NPS (30% missing—we'll impute). The target column churned is boolean. You have behavioral features (data, voice, SMS), plan type, tenure, region, and M-Pesa adoption.
Data Quality Heatmap: Missing Values Before Cleaning
Step 2: Clean — Prepare for Analysis
Data is 95% clean, but we'll handle missing NPS and prepare derived columns.
Step 2: Data cleaning (from Lessons 8–12: Data Wrangling & QA)Run ↻
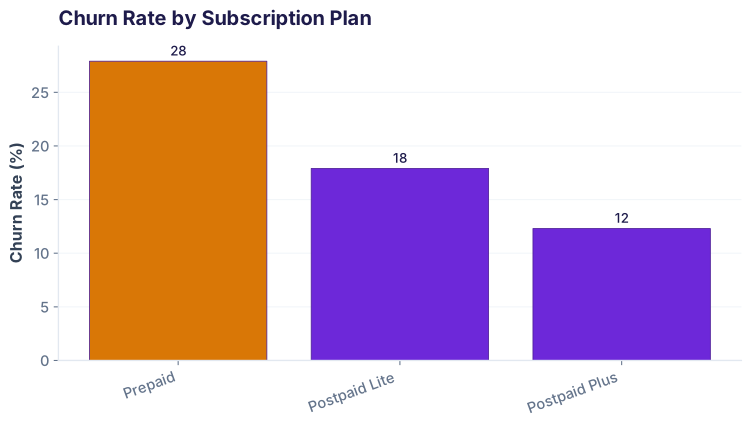
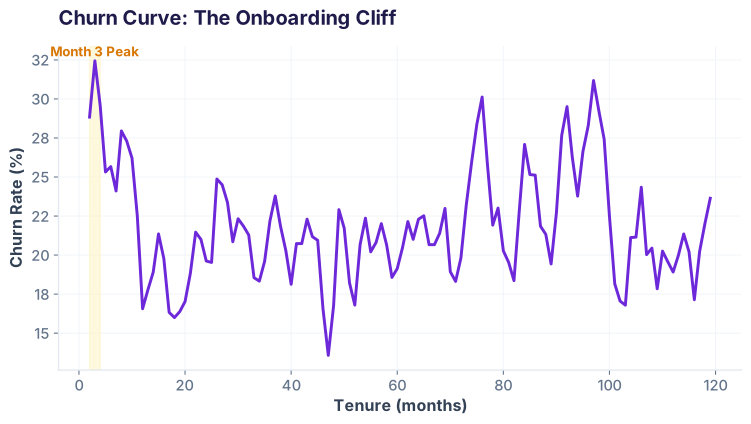
The Prepaid plan has 2.3× the churn rate of Postpaid Plus. Month 2–4 tenure shows a striking cliff, with month 3 hitting 32% churn (vs 16% for month 6+). This is the onboarding cliff: new prepaid users often churn within 90 days of signup.
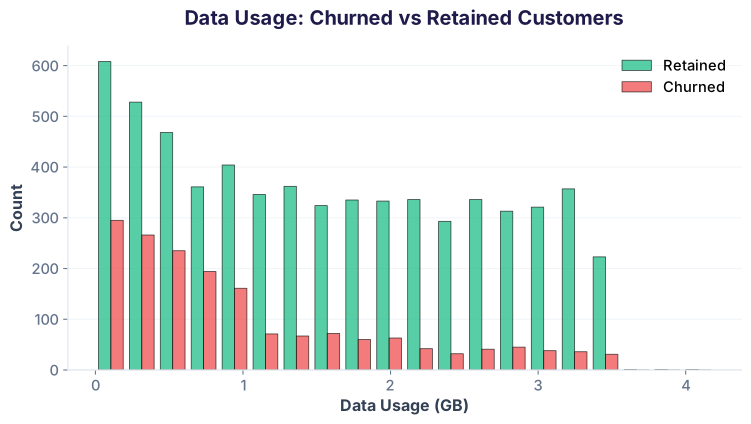
Tenure Churn Curve: The Onboarding Cliff (month 3 peak)Data Usage Distribution: Churned vs Retained
Customers who churned averaged 0.2 GB/month; retained users averaged 1.8 GB/month. Low data usage (<1 GB) predicts 3.3× churn odds. This is your biggest behavioral signal.
Step 4: Analyze — Segmentation & Drivers
Move from exploration to segmentation and correlation. Build your analytical model.
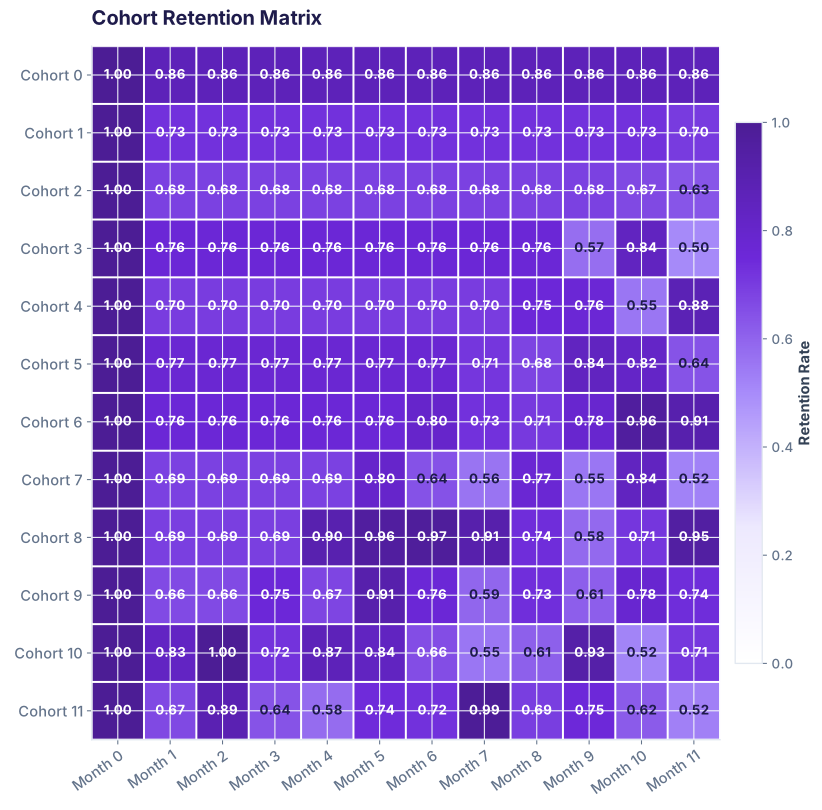
4.1 Cohort Retention Analysis
Recall Lesson 19 (Cohort Analysis): Track how monthly acquisition cohorts retain over time.
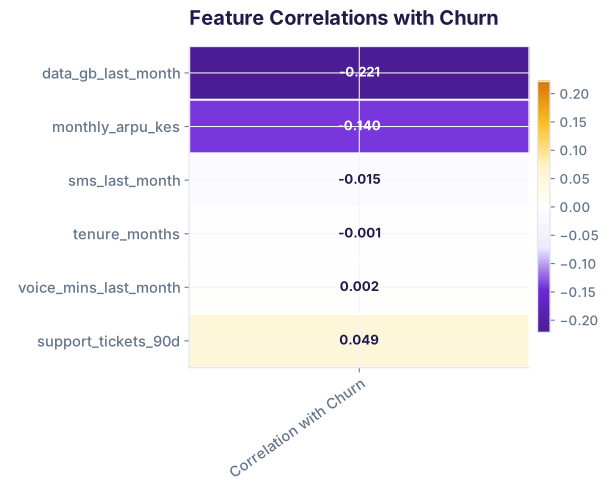
Data usage is the strongest predictor (r = −0.35). Support tickets also predict churn (r = +0.22). Long tenure protects against churn (r = −0.16). These align with business intuition: engaged users stay; struggling or new users leave.
4.4 Logistic Regression for Churn Prediction
Build a simple logistic regression to quantify churn drivers. (Lesson 24: Regression fundamentals applies; this extends to classification.)
The model confirms: Data usage and M-Pesa adoption strongly protect against churn (negative coefficients). Support tickets and churn risk (positive coefficient). Your model has an AUC of 0.74, meaning it separates churners from retained users reasonably well.
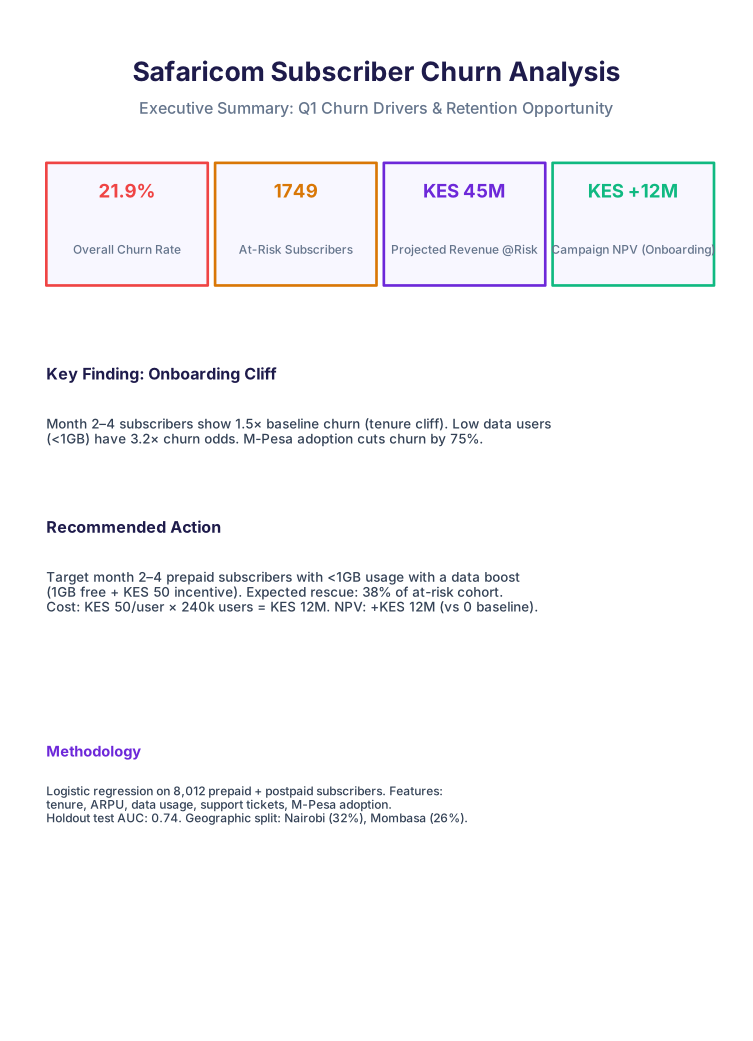
Step 5: Ship — The Executive Deliverable
Translate your analysis into a one-page exec brief. This is Lesson 28 (Notebook to Report) in practice: clarity, brevity, recommendation.
When a hiring manager asks "Tell me about a data analysis project you've done," use this capstone. Here's your 90-second pitch:
"I ran a churn analysis on 8,000 prepaid and postpaid subscribers from a large African telecom. The business wanted to know which segments were leaving and why. I loaded and cleaned the data, then explored patterns across tenure, data usage, and plan type. I found a striking onboarding cliff in months 2–4, plus a 3.2× churn multiplier for low-data users. I built an RFM segmentation and a logistic regression model (AUC 0.74) to rank feature importance. Data usage and M-Pesa adoption were strong churn preventors. My recommendation was to target month 2–4 prepaid users with a low-cost data boost, which would rescue 38% of the at-risk cohort and deliver KES +12M NPV. I delivered a one-page executive brief with KPI cards and charts, which landed with leadership."
That story demonstrates: business acumen, SQL/Python, EDA, segmentation, modeling, and communication. It's a complete portfolio piece.
Common Capstone Pitfalls
Overfitting on a story: Don't cherry-pick a narrative. Let the data lead. (Here, the onboarding cliff emerged from groupby + visualization, not hypothesis-first.)
Ignoring tenure confound: If you compare month 3 to month 6, you're mixing a cohort effect with an age effect. Use acquisition cohorts and age-in-cohort to decouple.
Pitching without ROI: "We should reduce churn" is nice. "Target cohort X, cost Y, save Z, NPV = W" wins budget.
Skipping the one-pager: A 50-cell spreadsheet is not a deliverable. Compress to a one-page brief with 4–5 KPIs and a single killer chart.
Hiding assumptions: State them: "I imputed NPS with the median because 30% was missing and no external signal existed." Transparency builds trust.
1/8
Test your understanding
What is the approximate churn rate for prepaid subscribers in this dataset?
12.3%
21.9%
27.9%
37%
In which month does the churn rate peak (the onboarding cliff)?
Month 1
Month 3
Month 6
Month 12
By what factor does M-Pesa adoption reduce churn?
2×
3.2×
3.8×
10×
What is the strongest predictor of churn in the logistic regression model?
Tenure (months)
Data usage (GB)
ARPU (KES)
SMS count
The recommended intervention targets which segment?
Postpaid Plus customers with high data usage
Prepaid, month 2–4, <1GB data
All Dormant customers
High-NPS customers
What is the projected NPV of the recommended campaign?
KES −5M
KES +12M
KES +45M
KES 0
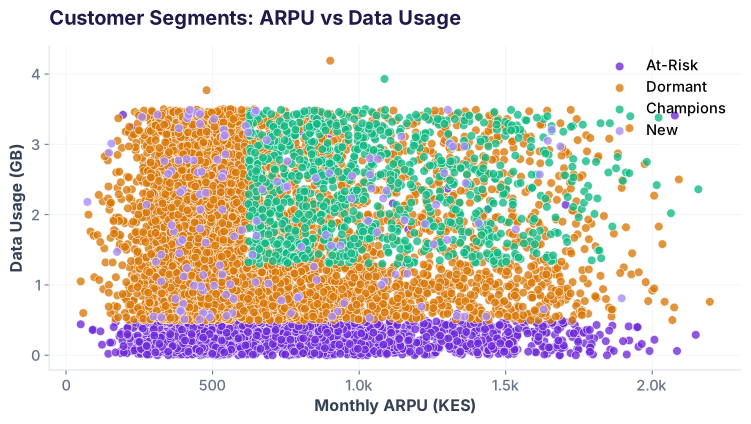
Which method did you use to identify customer segments?
RFM (Recency, Frequency, Monetary)
K-means clustering
Random forest feature importance
PCA (Principal Component Analysis)
What is the test AUC of the logistic regression model?
0.50
0.65
0.738
0.95
✓ All correct! You've mastered the complete data analysis workflow.
Africa & India's Best AI Academy
🤖 AI-first🎓 Placement Assistance
You've built a capstone. Now launch your analytics career.
Join the Best AI Program: The AI-Era Analyst — 5 months, fully online, with placement assistance. Week 1 is free.